
Synoptic View of Lithospheric S-Wave Velocity Structure in the Southern United States: A Comparison of 3D Seismic Tomographic Models
Alden Netto, Jay Pulliam, and Patricia Persaud

In this article
Authors
Alden Netto, Jay Pulliam
Dept. of Geosciences, Baylor University, Waco, Texas 76706, USA
Patricia Persaud
Dept. of Geology and Geophysics, Louisiana State University, Baton Rouge, Louisiana 70803, USA
Abstract
The southern U.S. continental margin records a history spanning ca. 1.2 Ga, including two Wilson cycles. However, due to a thick sediment cover, the paucity of significant local seismicity, and, until recently, sparse instrumentation, details of this passive margin’s tectonomagmatic evolution remain disputed. This paper compares recent S-wave tomography and crustal thickness models based on USArray data to help establish a framework for geodynamic interpretation. Large-scale patterns of crustal velocity anomalies, corresponding to major regional features such as the Ouachita orogenic front and the Precambrian margin, are generally consistent between the models. The spatial extent of smaller-scale tectonic features, such as the Sabine Uplift and Wiggins block, remains poorly resolved. An inverse relationship between crustal thickness and Bouguer gravity across the continental margin is observed. This model comparison highlights the need for additional P-wave tomography studies and targeted, higher density station deployments to better constrain tectonic features.
Manuscript received 19 Sept. 2018. Revised manuscript received 10 Jan. 2019. Manuscript accepted 14 Jan. 2019. Posted 13 Feb. 2019.
© The Geological Society of America, 2019. CC-BY-NC.
Introduction
The southern U.S. margin (Fig. 1) ranges from the stable Laurentia craton beneath Oklahoma to a stretched and thinned passive margin to oceanic lithosphere in the deep Gulf of Mexico, recording within it a geologic history that includes two complete Wilson cycles (Thomas, 2006). Due to its extensive hydrocarbon reserves, the southern U.S. has been the focus of intensive seismic exploration. However, until recently, studies of its deep structure trailed those of other U.S. continental margins. The result is that the tectonomagmatic evolution of the southern U.S. margin remains poorly understood. The primary contributing factors to this status quo are (1) the presence of a thick sediment cover that obscures crustal structure through most of the region, (2) the paucity of significant local seismicity, and, until recently, (3) sparse seismic instrumentation in the region. Earthscope’s USArray temporarily densified the set of broadband seismographs available for studies of the region’s lithosphere (http://www.usarray.org/researchers/obs/transportable). Approximately 435 stations occupied a total of 1830 locations in the continental U.S., for two years each, at a nominal spacing of 70 km. In USArray’s wake, there has been a surge in the number of continental-scale tomographic studies presenting snapshots of the compressional and shear wave velocities of the region’s crust and upper mantle. Although the volume of seismic data available for studies of the region has increased dramatically and sampling of the subsurface has improved as well, the presence of a thick layer of sediments and relatively low levels of seismicity (with the exception of Oklahoma) continue to challenge efforts to image the lithosphere.
Figure 1
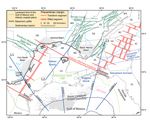
Tectonic map of the southern U.S. continental margin. Northern boundary of the Gulf of Mexico basin is represented by the Cretaceous shelf edge, adapted from Harry and Londono (2004). Locations of the GUMBO lines and the limit of oceanic crust in the Gulf of Mexico are from Christeson et al. (2014). Location of basinward salt limit is from Hudec et al. (2013). Louann salt province in the Gulf of Mexico, denoted by gray shading, is from Diegel et al. (1995). Locations of the Precambrian rift-transform margin, and other geologic structures and terranes, were derived from Thomas (1991, 2011). MU—Monroe Uplift; BU—Benton Uplift; BBU—Broken Bow Uplift; LU—Luling Uplift; WU—Waco Uplift; SMA—San Marcos Arch. L1 (onshore extension of GUMBO 1), L2, and L3 (onshore extension of GUMBO 3) are locations of cross-sectional profiles examined in Figures 4 and DR2 [see text footnote 1]. AL—Alabama; AR—Arkansas; LA—Louisiana; FL—Florida; GA—Georgia; KY—Kentucky; MO—Missouri; MS—Mississippi; NC—North Carolina; OK—Oklahoma; SC—South Carolina; TN—Tennessee; TX—Texas; VA—Virginia; WV—West Virginia.
The collection of models for the southern U.S. region represents the state-of-the-art of seismic tomography: a broad range of approaches, the inclusion of various types of data, and different choices of solution schemes. These seismic velocity models can be used to study the mineralogical, compositional, and thermal state of the current crust and upper mantle, and thereby provide critical constraints on geodynamic models, as well as serving as a foundation to launch further investigations. They also showcase the various techniques and innovations of seismic tomography. But, first, robust tectonic features must be identified. Well-constrained features should appear consistently across models. Differences between models could be due to (1) types of data incorporated, such as body wave arrival times, surface wave dispersion, receiver functions, or combinations of two or more data types; (2) measurement techniques employed; (3) the theoretical basis of the forward calculation, such as ray theory versus finite difference versus finite frequency; (4) the initial model and parameterization used; (5) regularization choices (“damping” and “smoothing” schemes and parameter values); and (6) inversion methods, such as gradient-based local minimization versus global optimization techniques.
The purpose of this study is to provide a systematic analysis of similarities and differences between recent shear wave tomographic models with respect to the lithospheric structure of the southern U.S. continental margin. Similar comparisons have been conducted for the western U.S. by Becker (2012) and Pavlis et al. (2012).
Tectonic Setting
The region that now comprises the southern U.S. has witnessed two complete Wilson cycles of orogeny and rifting (Fig. 1). These cycles can be chronologically split into four major tectonic events, beginning with the closing of an ocean and assembly of the Rodinia supercontinent.
- The Mesoproterozoic Grenville orogeny along the southern margin of Laurentia is a result of continent-continent and continent-arc-continent collision, a result of which is the ca. 1.2 Ga granitic core of the Llano uplift (Fig. 1) (e.g., Culotta et al., 1992; Mosher et al., 2008).
- The Grenville orogeny was followed by a Neoproterozoic rifting episode that resulted in the breakup of Rodinia and the subsequent opening of the Iapetus Ocean. The resulting passive margin, outlining the southeastern continental margin of Laurentia, is widely thought to be composed of a series of rift and transform segments (Hatcher et al., 1989; Thomas, 1991, 2011).
- The closing of the Iapetus Ocean and the consequent assembly of the Pangaea supercontinent during the late Paleozoic included a collision between Laurentia, Gondwana, and enclosed island arcs, which resulted in the Ouachita orogeny. Contemporaneous terranes that participated in the Ouachita orogeny, the composition and origin of which are widely debated, are associated with basement highs, such as the Sabine and Monroe uplifts in Louisiana and the Wiggins Arch in Alabama and Mississippi.
- Finally, Late Triassic rifting episodes, during the breakup of Pangaea, led to the opening of the Atlantic Ocean and the Gulf of Mexico (Dickinson, 2009; Thomas, 2011; Huerta and Harry, 2012). Continental extension, followed by mid-Jurassic seafloor spreading, produced the current configuration of an arcuate wedge of oceanic crust beneath the deep Gulf of Mexico surrounded by transitional continental crust of variable width (Christeson et al., 2014).
Although there is general agreement on the sequence of tectonic events that formed the present-day crustal structure of the southern U.S. continental margin, several details of its evolutionary history remain unresolved. These include, but are not limited to, the geometry of the Precambrian rift-transform margin, depth and spatial extent of the allochthonous terranes that participated in the Ouachita orogeny, and variations in continental stretching and magmatic activity across the northern Gulf of Mexico during Mesozoic rifting.
Velocity Models
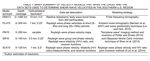
The following eight models are compared in this study: DNA13 (Porritt et al., 2014); PLH15 (Porter et al., 2016); PM15 (Pollitz and Mooney, 2016); SR16 (Shen and Ritzwoller, 2016); SLK15 (Schmandt et al., 2015); NA07 (Bedle and van der Lee, 2009); SL14 (Schmandt and Lin, 2014); and YFCR14 (Yuan et al., 2014). Our comparison is limited to shear wave velocity (Vs) models because only a few P-wave velocity models span the southern U.S. Table 1 presents pertinent details about models that include the crust: SR16, DNA13, PLH15, PM15, and SLK15. The latter four models were generated via an iterative, linearized inversion algorithm. The global optimization technique used to generate SR16 makes it unique within our set of models, allowing for more formal estimates of uncertainties. An extended review of data types and methods used to generate all eight models examined in this study is presented in the GSA Data Repository1; for further details readers are referred to the original publications.
-------
1GSA Data Repository item 2019099, an extended review of data types and methods used to generate all eight models examined in this study, is available online at www.geosociety.org/datarepository/2019.
Table 1
Crustal Thickness Models
Crustal thickness varies substantially across passive margins, including the northern Gulf of Mexico, and hence serves as an important parameter in reconstructing the tectonic evolution and pre-rift geometry of such regions (Reston and Morgan, 2004; Huismans and Beaumont, 2011; Sutra and Manatschal, 2012). To evaluate crustal thickness variations across the study region, four models were considered: SLK15, SR16, PnUS2016, and LITHO1.0. PnUS2016 (Buehler and Shearer, 2017) uses Pn arrivals, which are P waves that refract just below the Moho and are the first arrivals at regional distances, to constrain crustal thickness. PnUS2016 utilizes the seismic velocities from SR16 to map crustal thickness. LITHO1.0 (Pasyanos et al., 2014) is constructed by perturbing an initial model parameterized vertically as a series of geophysically identified layers, that is, a combination of the CRUST1.0 model (Laske et al., 2012) and the LLNL-G3D model (Simmons et al., 2012), to fit surface wave dispersion maps over the 5–40 mHz frequency band. Additionally, Moho depths from velocity models based on results from the 2010 GUMBO experiments, consisting of four long-offset seismic refraction profiles in the northern Gulf of Mexico (Fig. 1) (Eddy, 2014; Christeson et al., 2014; Eddy et al., 2014; Van Avendonk et al., 2015), were digitized and added to the comparison. With 11–12-km station spacing and the incorporation of coincident seismic reflection data, crustal thickness estimates from the GUMBO lines have the highest resolution in this study.
Data and Methods
Model comparisons with original figures are complicated by the different choices authors make with respect to presentation: color scales and ranges, color palettes, and perturbations with respect to a model average or a global standard, etc. Here we plot all models on the same scale, in terms of perturbations with respect to the average of all models, using a consistent color scale. Most models used in this study were downloaded from the IRIS Earth Model Collaboration (http://ds.iris.edu/ds/products/emc); others were received via private correspondence. Using MATLAB, each velocity model was linearly interpolated onto a three-dimensional (3D) grid with 0.2° × 0.2° uniform lateral spacing and 0.5-km depth spacing. For the southern U.S., the domain of interest was bounded latitudinally between 26°–37° N and longitudinally between 78°–102° W. Using the interpolated shear velocity models, the lateral root-mean-square velocity, Vrms, for each model was calculated and compiled to create average one-dimensional (1D) velocity individual models, and an average 1D model for the study area (SUSavg; Fig. 2A). This procedure was repeated to create similar 1D shear velocity models for the western U.S. (WUS), 28°–50° N by 102°–130° W; the central U.S. (CUS), 36°–50° N by 90°–102° W; and the eastern U.S. (EUS), 36°–50° N by 70°–90° W (Fig. 2B). In addition to the original data set, models by Schmandt and Humphreys (2010), James et al. (2011), Obrebski et al. (2011), and Chai et al. (2015) were used for the western U.S.; results from Chen et al. (2016) were used for the central U.S.; and the model by Savage et al. (2016) was used for the eastern U.S. Figure 3 displays model perturbations with respect to SUSavg at four depths: 5 km and 15 km plus 5 km above and 5 km below the Moho, with cooler colors (blue and green) representing faster regions and warmer colors (red and yellow) representing slower regions. Authors of each model indicate their best guess of the Moho depth throughout their model, so the last two panels represent different absolute depths for each model. Perturbations of models at depths of 75 km, 150 km, 400 km, and 415 km are presented in the GSA Data Repository (see footnote 1).
Figure 2
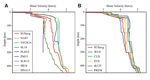
(A) RMS shear wave velocity computed from the eight velocity models spanning the southern U.S. (SUS), along with our average model (SUSavg). (B) Comparison of SUSavg with the average model for the other domains of the U.S.: WUS—Western U.S.; CUS—Central U.S.; and EUS—Eastern U.S., as well as the 1D reference models, ak135 and PREM.
Figure 3
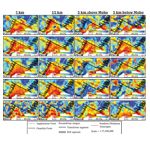
Depth slices of shear wave velocity perturbations of models PLH15, PM15, SLK15, SR16, and DNA13 (rows; top to bottom) at 5-km, 15-km, 5-km above the Moho, and 5-km below the Moho (columns; left to right), with LU (white) highlighting the location of the Llano Uplift.
Results and Interpretations
Velocity Models for the Southern U.S. and Comparison to Other Regions
Root-mean-square velocities (Vrms) as a function of depth for the 3D models introduced above are shown in Figure 2A. The models fall into two distinct groupings: (1) PLH15, SLK15, SR16, and SL14 and (2) PM15, NA07, YFCR14, and DNA13, with as much as ~0.75 km/s difference between the two groups at upper mantle depths. The average of all models is shown in red (SUSavg). Comparable regional averages for the eastern, western, and central U.S. are shown in Figure 2B, along with the SUSavg, and the 1D reference models, ak135, and PREM.
All four average regional models (Fig. 2B) show the Moho at deeper depths than the reference 1D models. CUS has the highest velocities in the crust and upper mantle, which is consistent with the fact that it largely represents the cratonic core of Laurentia. Due to the presence of thick sedimentary basins in the southern U.S., SUSavg has the lowest velocities in the uppermost crust. In the upper mantle, however, the western U.S. (WUS) is the slowest of all models. Despite the lack of recent tectonism in the southern U.S. margin, the SUSavg model is more similar to the WUS model for the tectonically active western U.S. than any of the other models. Interestingly, Gulf Coast Q0-values (Q at 1 Hz) are also considerably lower than mid-continent values but similar to those in the western U.S., with boundaries that correspond to the Oklahoma-Alabama Transform and Ouachita thrust (Cramer, 2017). The SUSavg model is also distinctly slower than the EUS model at all depths.
Geologic and Tectonic Patterns
In the upper crust, large-scale patterns of anomalies are consistent between all the models, matching the geometry of major features in the region; i.e., the Ouachita orogenic front and the Precambrian margin (Fig. 3 with locations in Fig. 1). Areas to the north of the Precambrian margin, which comprise cratonic continental crust, are faster at shallower depths than in the region enclosed between the Alabama-Oklahoma transform and Texas Rift segments, which is covered by thick sediments. This latter region displays a reversal in anomalies in three of the five models (PLH15, SR16, and SLK15) at depths around the Moho. This fast velocity zone could correspond to the base of the Sabine block, as proposed by Clift et al. (2018). The Southern Oklahoma Aulacogen is consistently represented in the models by a slow anomaly, although with varying size, geometry, and location. Conversely, the Llano Uplift is represented by a fast anomaly that is especially prominent at shallow depths. A large proportion of the seismic data used to generate the models derives from the USArray’s Transportable Array (TA), which has a nominal station spacing of ~70 km. The resulting relatively low horizontal resolution of these models makes it difficult to constrain effectively the exact geometry of small-scale geologic features in this region.
Amplitudes of anomalies vary significantly between models (note the different ranges in the color bars). There are at least two reasons to expect such variations. First, constraints imposed by data on model parameters usually range from overdetermined to underdetermined in tomography, so additional regularization is needed to stabilize the inversion numerically. Choices of values for regularization parameters are largely subjective and will therefore differ between authors. Second, only a portion of the travel time variance is explained by the 3D structure to be resolved. Other components of the variance include random and systematic errors in the data, inaccuracies in the model parameterization’s representation of Earth, and oversimplifications in the physical theory that relates Earth’s structure to travel time observations. Again, differences between individual choices will map into differences in anomaly amplitudes, although patterns should be robust between techniques and parameterizations.
PM15 shows the least change in anomaly pattern from 5 km depth to 5 km below the Moho, reflecting its decreasing resolution with depth. DNA13 has a relatively small range of anomaly amplitudes at depths of 5 km and 15 km, with less consistent anomaly patterns compared to the other models (Fig. 2). This difference, with respect to other models, is likely due to the lack of surface wave data in DNA13.
Crustal Thickness Variations
Figure 4 shows the Bouguer gravity anomaly, topography, and crustal thickness along the L1-GUMBO1 and L3-GUMBO3 profiles (onshore extensions of GUMBO1 and GUMBO3; see locations in Fig. 1) based on the models discussed above. Similar profiles for L2, GUMBO2, and GUMBO4 are shown in GSA Data Repository Figure DR2 (see footnote 1). A general trend exhibiting crustal thinning toward the Gulf of Mexico basin, corresponding to a steady increase in Bouguer gravity anomalies, is consistent among the models. SLK15 and SR16 are consistent along the L1-GUMBO1 profile, while a crossover with PnUS2016 is observed around the 400-km profile distance, in the vicinity of the San Marcos Arch. The LITHO1.0 model has the largest deviations from the other models; due to its sparse parameterization, LITHO1.0 is not a reliable benchmark in regional studies.
There is a lack of general agreement between models concerning the landward limit of oceanic crust in the Gulf of Mexico (arrows in Fig. 4). Along GUMBO3, the majority of the proposed locations are coincident with a sharp increase in Bouguer gravity, which is not the case along GUMBO1 in the western Gulf of Mexico, where the large Louann salt province complicates geophysical interpretation.
Figure 4
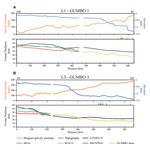
Cross-sectional profiles of (A) the L1-GUMBO1 line and (B) the L3-GUMBO3 line (profile locations in Fig. 1), displaying lateral variation in Bouguer gravity anomaly, topography, and crustal thickness based on models SR16, SLK15, PnUS2016, and LITHO1.0, along with that from the GUMBO studies. The colored arrows represent the proposed location of the ocean-continent boundary from Marton and Buffler (1994) (yellow); Bird et al. (2005) (purple); Hudec et al. (2013) (light green); Christeson et al. (2014) (red); Pindell and Kennan (2009) (orange); Sandwell et al. (2014) (dark green); Pindell et al. (2014) (dark blue); and Sawyer et al. (1991) (light blue).
Discussion and Conclusions
The general consistency of large-scale anomaly patterns between models within the upper crust suggests that data selection is more important than model parameterization, forward modeling and inversion methods, and other methodological differences. However, disparities in anomaly amplitudes and the fact that the velocity models fall into two distinct groups (which is discussed in the GSA Data Repository [see footnote 1]) present a challenge for geodynamic interpretations of the margin, for understanding the margin’s magmatic evolution, and for reconstructions of its pre-rift crustal and lithospheric thickness. It is clear that current 3D velocity models are unable to resolve the geometry of some smaller-scale tectonic features of this region, such as the spatial extent of the Wiggins block, or smaller arches (e.g., Luling, Waco, San Marcos), and to test the extent to which magmatic input facilitated rifting in the northern Gulf of Mexico.
This comparison serves as a baseline for future geological and geophysical investigations in the southern U.S. by providing a comprehensive assessment of currently available S-wave tomographic models. There is a need for additional P-wave tomography studies within this region which, given the lack of regional seismicity, is difficult but essential.
Acknowledgments
We thank two anonymous reviewers and editor Mihai Ducea for their thoughtful and constructive comments that helped improve the manuscript. Thanks to Fred Pollitz and Cemal Biryol for providing their velocity models to us directly and to the authors of other models for contributing them to the IRIS Earth Model Collaboration (http://ds.iris.edu/ds/products/emc).
References
- Becker, T.W., 2012, On recent seismic tomography for the western United States: Geochemistry Geophysics Geosystems, v. 13, Q01W10, https://doi.org/10.1029/2011GC003977.
- Bedle, H., and van der Lee, S., 2009, S velocity variations beneath North America: Journal of Geophysical Research, Solid Earth, v. 114, B07308, https://doi.org/10.1029/2008JB005949.
- Bensen, G.D., Ritzwoller, M.H., Barmin, M.P., Levshin, A.L., Lin, F., Moschetti, M.P., Shapiro, N.M., and Yang, Y., 2007, Processing seismic ambient noise data to obtain reliable broad-band surface wave dispersion measurements: Geophysical Journal International, v. 169, p. 1239–1260, https://doi.org/10.1111/ j.1365-246X.2007.03374.x.
- Bird, D.E., Burke, K., Hall, S.A., and Casey, J.F., 2005, Gulf of Mexico tectonic history: Hotspot tracks, crustal boundaries, and early salt distribution: AAPG Bulletin, v. 89, p. 311–328, https://doi.org/10.1306/10280404026.
- Buehler, J.S., and Shearer, P.M., 2017, Uppermost mantle seismic velocity structure beneath USArray: Journal of Geophysical Research, Solid Earth, v. 122, https://doi.org/10.1002/ 2016JB013265.
- Chai, C., Ammon, C.J., Maceira, M., and Herrmann, R.B., 2015, Inverting interpolated receiver functions with surface wave dispersion and gravity: Application to the western U.S. and adjacent Canada and Mexico: Geophysical Research Letters, v. 42, p. 4359–4366, https://doi.org/10.1002/2015GL063733.
- Chen, C., Gilbert, H., Andronicos, C., Hamburger, M.W., Larson, T., Marshak, S., Pavlis, G.L.., and Yang, X., 2016, Shear velocity structure beneath the central United States: Implications for the origin of the Illinois Basin and intraplate seismicity: Geochemistry Geophysics Geosystems, v. 17, p. 1020–1041, https://doi.org/ 10.1002/2015GC006206.
- Christeson, G.L., Van Avendonk, H.J.A., Norton, I.O., Snedden, J.W., Eddy, D.R., Karner, G.D., and Johnson, C.A., 2014, Deep crustal structure in the eastern Gulf of Mexico: Journal of Geophysical Research, Solid Earth, v. 119, p. 6782–6801, https://doi.org/10.1002/ 2014JB011045.
- Clift, P.D., Heinrich, P., Dunn, D., Jacobus, A., and Blusztajn, J., 2018, The Sabine block, Gulf of Mexico: Promontory on the North American margin?: Geology, v. 46, p. 15–18, https://doi.org/ 10.1130/G39592.1.
- Cramer, C.H., 2017, Gulf Coast regional Q and boundaries from USArray data: Bulletin of the Seismological Society of America, v. 108, p. 437–449, https://doi.org/10.1785/0120170170.
- Culotta, R., Latham, T., Sydow, M., Oliver, J., Brown, L., and Kaufman, S., 1992, Deep structure of the Texas Gulf Passive Margin and its Ouachita-Precambrian Basement: Results of the COCORP San Marcos Arch Survey (1): AAPG Bulletin, v. 76, p. 270–283.
- Dickinson, W.R., 2009, The Gulf of Mexico and the southern margin of Laurentia: Geology, v. 37, p. 479–480, https://doi.org/10.1130/focus052009.1.
- Diegel, F.A., Karlo, J.F., Schuster, D.C., Shoup, R.C., and Tauvers, and P.R., 1995, Cenozoic structural evolution and tectono-stratigraphic framework of the Northern Gulf Coast Continental Margin, in Jackson, M.P.A., Roberts, D.G., and Snelson, S., eds., Salt Tectonics: A Global Perspective: AAPG Memoir 65, p. 109–151.
- Eddy, D.R., 2014, Mesozoic rifting along the eastern seaboard of North America: Insights from the seismic velocity structure of the Newfoundland margin and the northern Gulf of Mexico [Ph.D. thesis]: The University of Texas at Austin, 318 p.
- Eddy, D.R., Van Avendonk, H.J.A., Christeson, G.L., Norton, I.O., Karner, G.D., Johnson, C.A., and Snedden, J.W., 2014, Deep crustal structure of the northeastern Gulf of Mexico: Implications for rift evolution and seafloor spreading: Journal of Geophysical Research, Solid Earth, v. 119, p. 6802–6822, https://doi.org/10.1002/ 2014JB011311.
- Harry, D.L., and Londono, J., 2004, Structure and evolution of the central Gulf of Mexico continental margin and coastal plain, southeast United States: Geological Society of America Bulletin, v. 116, p. 188–199, https://doi.org/ 10.1130/B25237.1.
- Hatcher, R.D., Thomas, W.A., and Viele, G.W., editors, 1989, The Appalachian-Ouachita Orogen in the United States: Boulder, Colorado, Geological Society of America, Geology of North America, v. F2, 784 p., https://doi.org/ 10.1130/DNAG-GNA-F2.
- Hudec, M.R., Norton, I.O., Jackson, M.P.A., and Peel, F.J., 2013, Jurassic evolution of the Gulf of Mexico salt basin: AAPG Bulletin, v. 97, p. 1683–1710, https://doi.org/10.1306/ 04011312073.
- Huerta, A.D., and Harry, D.L., 2012, Wilson cycles, tectonic inheritance, and rifting of the North American Gulf of Mexico continental margin: Geosphere, v. 8, p. 374–385, https://doi.org/10.1130/GES00725.1.
- Huismans, R., and Beaumont, C., 2011, Depth-dependent extension, two-stage breakup and cratonic underplating at rifted margins: Nature, v. 473, p. 74–78, https://doi.org/10.1038/nature09988.
- James, D.E., Fouch, M.J., Carlson, R.W., and Roth, J.B., 2011, Slab fragmentation, edge flow and the origin of the Yellowstone hotspot track: Earth and Planetary Science Letters, v. 311, p. 124–135, https://doi.org/10.1016/j.epsl.2011.09.007.
- Laske, G., Masters, G., Ma, Z., and Pasyanos, M.E., 2012, CRUST1.0: An updated global model of the Earth’s crust: EGU General Assembly, v. 14, EGU2012-3743-1.
- Lin, F.-C., Tsai, V.C., and Schmandt, B., 2014, 3-D crustal structure of the western United States: Application of Rayleigh-wave ellipticity extracted from noise cross-correlations: Geophysical Journal International, v. 198, p. 656–670, https://doi.org/10.1093/gji/ggu160.
- Liu, Y., and Holt, W.E., 2015, Wave gradiometry and its link with Helmholtz equation solutions applied to USArray in the eastern U.S.: Journal of Geophysical Research, Solid Earth, v. 120, p. 5717–5746, https://doi.org/10.1002/ 2015JB011982.
- Marton, G., and Buffler, R.T., 1994, Jurassic reconstruction of the Gulf of Mexico basin: International Geology Review, v. 36, p. 545–586, https://doi.org/10.1080/00206819409465475.
- Mosher, S., Levine, J.S.F., and Carlson, W.D., 2008, Mesoproterozoic plate tectonics: A collisional model for the Grenville-aged orogenic belt in the Llano uplift, central Texas: Geology, v. 36, p. 55–58, https://doi.org/10.1130/G24049A.1.
- Obrebski, M., Allen, R.M., Pollitz, F., and Hung, S., 2011, Lithosphere-asthenosphere interaction beneath the western United States from the joint inversion of body‐wave traveltimes and surface‐wave phase velocities: Geophysical Journal International, v. 185, p. 1003–1021, https://doi.org/10.1111/j.1365-246X.2011.04990.x.
- Pasyanos, M.E., Masters, T.G., Laske, G., and Ma, Z., 2014, LITHO1.0: An updated crust and lithospheric model of the Earth: Journal of Geophysical Research, Solid Earth, v. 119, p. 2153–2173, https://doi.org/10.1002/ 2013JB010626.
- Pavlis, G., Sigloch, K., Burdick, S., Fouch, M.J., and Vernon, F.L., 2012, Unraveling the geometry of the Farallon plate: Synthesis of three-dimensional imaging results from USArray: Tectonophysics, v. 532–535, p. 82–102, https://doi.org/10.1016/j.tecto.2012.02.008.
- Pindell, J., Graham, R., and Horn, B., 2014, Rapid outer marginal collapse at the rift to drift transition of passive margin evolution, with a Gulf of Mexico case study: Basin Research, v. 26, p. 701–725, https://doi.org/10.1111/bre.12059.
- Pindell, J.L., and Kennan, L., 2009, Tectonic evolution of the Gulf of Mexico, Caribbean and northern South America in the mantle reference frame: An update, in James, K.H., Lorente, M.A., and Pindell, J.L., eds., The Origin and Evolution of the Caribbean Plate: Geological Society, London, Special Publication 328, p. 1–55, https://doi.org/10.1144/SP328.1.
- Pollitz, F.F., and Mooney, W.D., 2016, Seismic velocity structure of the crust and shallow mantle of the central and eastern United States by seismic surface wave imaging: Geophysical Research Letters, v. 43, p. 118–126, https:// doi.org/10.1002/2015GL066637.
- Pollitz, F.F., and Snoke, A.J., 2010, Rayleigh‐wave phase‐velocity maps and three‐dimensional shear velocity structure of the western US from local non‐plane surface wave tomography: Geophysical Journal International, v. 180, p. 1153–1169, https://doi.org/10.1111/ j.1365-246X.2009.04441.x.
- Porritt, R.W., Allen, R.M., and Pollitz, F.F., 2014, Seismic imaging east of the Rocky Mountains with USArray: Earth and Planetary Science Letters, v. 402, p. 16–25, https://doi.org/ 10.1016/j.epsl.2013.10.034.
- Porter, R., Liu, Y., and Holt, W.E., 2016, Lithospheric records of orogeny within the continental U.S.: Geophysical Research Letters, v. 43, 2015GL066950, https://doi.org/10.1002/ 2015GL066950.
- Reston, T.J., and Morgan, J.P., 2004, Continental geotherm and the evolution of rifted margins: Geology, v. 32, p. 133–136, https://doi.org/ 10.1130/G19999.1.
- Sandwell, D.T., Müller, R.D., Smith, W.H.F., Garcia, E., and Francis, R., 2014, New global marine gravity model from CryoSat-2 and Jason-1 reveals buried tectonic structure: Science, v. 346, p. 65–67, https://doi.org/10.1126/science.1258213.
- Savage, B., Covellone, B.M., and Shen, Y., 2016, Wave speed structure of the eastern North American margin: Earth and Planetary Science Letters, v. 459, p. 394–405, https://doi.org/ 10.1016/j.epsl.2016.11.028.
- Sawyer, D.S., Buffler, R.T., and Pilger, R.H., Jr., 1991, The crust under the Gulf of Mexico Basin, in Salvador, Amos, ed., The Gulf of Mexico Basin: Geological Society of America, Geology of North America, v. J, p. 53–72.
- Schmandt, B., and Humphreys, E., 2010, Complex subduction and small-scale convection revealed by body-wave tomography of the western United States upper mantle: Earth and Planetary Science Letters, v. 297, p. 435–445, https://doi.org/10.1016/j.epsl.2010.06.047.
- Schmandt, B., and Lin, F.-C., 2014, P and S wave tomography of the mantle beneath the United States: Geophysical Research Letters, v. 41, p. 6342–6349, https://doi.org/10.1002/ 2014GL061231.
- Schmandt, B., Lin, F.-C., and Karlstrom, K.E., 2015, Distinct crustal isostasy trends east and west of the Rocky Mountain Front: Geophysical Research Letters, v. 42, p. 10,290–10,298, https://doi.org/10.1002/2015GL066593.
- Shen, W., and Ritzwoller, M.H., 2016, Crustal and uppermost mantle structure beneath the United States: Journal of Geophysical Research, Solid Earth, v. 121, p. 4306–4342, https://doi.org/ 10.1002/2016JB012887.
- Shen, W., Ritzwoller, M.H., Schulte-Pelkum, V., and Lin, F.-C., 2013, Joint inversion of surface wave dispersion and receiver functions: A Bayesian Monte-Carlo approach: Geophysical Journal International, v. 192, p. 807–836, https://doi.org/10.1093/gji/ggs050.
- Simmons, N.A., Myers, S.C., Johannesson, G., and Matzel, E., 2012, LLNL-G3Dv3: Global P wave tomography model for improved regional and teleseismic travel time prediction: Journal of Geophysical Research, Solid Earth, v. 117, B10302, https://doi.org/10.1029/2012JB009525.
- Sutra, E., and Manatschal, G., 2012, How does the continental crust thin in a hyperextended rifted margin? Insights from the Iberia margin: Geology, v. 40, p. 139–142, https://doi.org/ 10.1130/G32786.1.
- Thomas, W.A., 1991, The Appalachian-Ouachita rifted margin of southeastern North America: Geological Society of America Bulletin, v. 103, p. 415–431, https://doi.org/10.1130/0016-7606 (1991)103<0415:TAORMO>2.3.CO;2.
- Thomas, W.A., 2006, Tectonic inheritance at a continental margin: GSA Today, v. 16, p. 4–11, https://doi.org/10.1130/1052-5173(2006)016 [4:TIAACM]2.0.CO;2.
- Thomas, W.A., 2011, The Iapetan rifted margin of southern Laurentia: Geosphere, v. 7, p. 97–120, https://doi.org/10.1130/GES00574.1.
- Van Avendonk, H.J.A., Christeson, G.L., Norton, I.O., and Eddy, D.R., 2015, Continental rifting and sediment infill in the northwestern Gulf of Mexico: Geology, v. 43, p. 631–634, https://doi.org/10.1130/G36798.1.
- Yuan, H., French, S., Cupillard, P., and Romanowicz, B., 2014, Lithospheric expression of geological units in central and eastern North America from full waveform tomography: Earth and Planetary Science Letters, v. 402, p. 176–186, https://doi.org/ 10.1016/j.epsl.2013.11.057.
