

In this article
Authors
Declan De Paor
Departments of Physics & Ocean, Earth, and Atmospheric Sciences, Old Dominion University, Norfolk, Virginia 23529, USA
Paul Karabinos
Department of Geosciences, Williams College, Williamstown, Massachusetts 01267, USA
Gerald Dickens
Department of Earth Science, Rice University, Houston, Texas 77005, USA
Christopher Atchison
School of Education & Department of Geology, University of Cincinnati, Cincinnati, Ohio 45221, USA
Abstract
Color Vision Deficiency (CVD) is a common workplace disability. People with CVD read our papers and are most likely in all of our classes. Here we discuss the common forms of CVD, assistive technologies, instructional strategies, and guidelines for illustrations that will look great to everyone.
Email: ddepaor@odu.edu
Manuscript received 6 Oct. 2016; Revised manuscript received 11 Dec. 2016; Manuscript accepted 14 Dec. 2016; Posted online 24 Feb. 2017
Introduction
In his 1973 hit Kodachrome, Paul Simon sang,
“They give us those nice bright colors / They give us the greens of summers /… everything looks worse in black and white …”
However, everyone does not see colors identically. GSA Today has 25,000 subscribers, so statistically, that will include more than 1,300 individuals with CVD 1 . When authors neglect this in drafting illustrations, many readers miss key points. A reader of De Paor (2016) pointed out that one figure used a dark red line against a dark green background, prompting this article. The paper proceeded through review to publication because those involved had fully functioning trichromacy, despite awareness of CVD and a strong commitment to accessibility. Here, we aim to increase awareness among authors, referees, editors, presenters, instructors, students, and administrators, pointing to new optical and digital assistive technologies, and highlighting guidelines for CVD-compliant instruction and illustration.
1 We eschew the common term “colorblind” to avoid implying monochromacy, to support person-first language (“persons with CVD,” not “colorblind people”), and to distinguish CVD from racially inclusive policies.
Types and Prevalence of CVD
Common forms of CVD are called red-green (RG) CVD. Protan (red) or deutan (green) photopigment molecules work incorrectly (anomaly) or not at all (anopia). Some 8% of men of mainly European, North African, and Middle Eastern ancestry have RG-CVD. Prevalence is lower among other males and ~0.5% among all females. Male rates reach 15% in consanguineous populations (Shah et al., 2013). Rare Blue CVD and monochromacy affect men and women equally. Effects range from minor spectral shifts to total dichromacy.
CVD can be acquired but is usually inherited. Dalton (1798) published the first account of the condition that he discovered in himself after causing familial scandal by gifting his mother racy red lingerie, seeing it as beige (qi.com/infocloud/color-blindness). His brother could not see the problem either, leading Dalton to conclude that CVD was hereditary. We now know that the relevant genes are coded on the X-chromosome. Men inherit from parents or grandparents, whereas women must inherit from both parents, hence the 16:1 ratio.
Figure 1
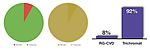
Color presentation styles. (A) Pie chart: difficult to quantify because the size of the red pie slice is not specified and the legend is inscrutably small. (B) Colors in (A) are almost indistinguishable to people with RG-CVD. (C) The same data are clear to all in an annotated bar chart.
Testing and Accommodating Students with CVD
Instructors should include CVD in the special needs sections of their syllabi and should present students with a pseudoisochromatic plate—a circle of multicolored dots that reveal a number given normal vision (Ishihara, 1917). Students who cannot see the number can take more sophisticated tests such as anomaloscopes (Nagel, 1907).
According to Maule and Featonby (2016), most instructors underestimate the number of their students with CVD and do little to accommodate them. Institutions provide accommodations to 88% of students with disabilities who self-disclose, but only 40% of such students do so (Wagner et al., 2005). Students strive to fit in and avoid special treatment, fearing bias and stereotype. Research suggests that the willingness of instructors to provide accommodations is based solely on how disabled a student appears (Rao and Gartin, 2003). Professors may think students with non-apparent conditions are malingering—trying to receive preferential treatment, rather than reasonable accommodation to complete an activity. Whereas a student can pretend not to see a Ishihara plate number, it is impossible to fake an anomaloscope. Students with verifiable CVD deserve support in lecture, laboratory, and the field.
Optical and Digital Assistive Technologies
Glasses such as O2AMP™ and EnChroma® may benefit some anomalous trichromats. Today, microscopes often
output to monitors, and images can be spectrally shifted with Photoshop™ or Fiji (fiji.sc). Visolve (ryobi-sol.co.jp/visolve/en) transforms images to help distinguish ranges of colors. The Chrome browser’s Daltonize extension enhances contrast and intensity, and there are bookmarklets for Firefox and Safari (daltonize.appspot.com). Mobile apps such as Color Blind Pal identify colors in the field of view, filter or shift them, and highlight matching colors.
Preparing Images for All to See
Assistive technologies notwithstanding, there is no substitute for well-designed illustrations. Whether destined for presentation or publication, images should always be tested using vischeck.com, color-blindness.com, colorbrewer2.org, contrastchecker.com, Sim Daltonism, Adobe Illustrator, etc. An extensive literature review is beyond the scope of this article, but we here summarize the most frequently cited best practices for publication, presentation, and instruction:
- Select graphic styles for accessibility: Figure 1 shows two presentation styles. The pie chart (A) is difficult to quantify and the legend is inscrutably small. (B) Colors in (A) are almost indistinguishable to people with RG-CVD. The same data are clear to all in an annotated bar chart (C). On GSA’s web page www.geosociety.org/documents/gsa/about/MbrDemographics.pdf, the Professional Interests chart is clear to all but the Employment Type chart is totally illegible to some. Numerous other good and bad examples can be found via Google.
- Redundancy: Distinguish items by more than color. Use circles and squares and solid and dashed lines. Label items directly, not in a key.
- Color choice: Colors differing only in hue, especially percentage red or green, cause problems. Dark red–dark green, blue–violet, red–orange, and yellow–green confusion is common. Magenta and turquoise are good choices because people with RG-CVD can see the blue component.
- Thickness, brightness, and contrast: People with RG-CVD cannot see thin lines or small polygons because insufficient functioning retinal cones are activated. Make lines thick and use high-contrast text, arrows, or other shapes. Drop-shadows and boxes make text stand out. Saturation and brightness variations are critical.
- Avoid rainbow color maps: Despite copious research showing that it is the worst possible choice (e.g., Light and Bartlein, 2004), the rainbow color map continues to be popular (Borland and Taylor, 2007). Although violet and red are the extremes of visible light, they do not convey different magnitudes to the brain. A diverging color map does (www.kennethmoreland.com/color-maps/).
Presenting and Instructing
In addition to preparing illustrations well, a presenter’s words, gestures, and actions are important. Individuals with RG-CVD commonly cannot identify colors, even if they can distinguish them. Instead of referring to a “pink curve,” say “the pink, dashed curve at top left.”
Red laser pointers are extremely difficult for some to see (Okabe and Ito, 2008). Green ones are superior (conference organizers please note!) and are also good for pointing to stars and planets.
Discussion and Conclusions
Gene therapy offers hope for a cure (Gudgel, 2015; Saey, 2016), but for the foreseeable future, RG-CVD will remain prevalent. Government agencies have Section 508 Standards including guidelines for CVD-compliant documents. See, for example: section508.va.gov, colorusage.arc.nasa.gov/indiv_diffs.php, and nws.noaa.gov/sec508.
People with CVD typically prefer black and white to color. In fact, in his 1982 album, Concert in Central Park, Paul Simon changed the “Kodachrome” lyrics to “everything looks better in black and white.”
However, we must recognize that trichromats will continue to prefer color whenever available. The key is to design for inclusivity. Color images crafted to be clearly visible to individuals with CVD will look better to everyone. To continue the discussion, please visit: www.theiagd.org/resources/color-vision-deficiency.
Acknowledgments
We thank Rick Murray of Boston University and two anonymous reviewers for very useful suggestions. Our research was supported by NSF DUE 1323419.
References
- Borland, D., and Taylor, R.M., II, 2007, Rainbow color map (still) considered harmful: IEEE Computer Graphics and Applications, v. 27, no. 2, p. 14–17, doi: 10.1109/MCG.2007.323435.
- Dalton, J., 1798, Extraordinary facts relating to the vision of colours: With observations: Memoirs of the Literary and Philosophical Society of Manchester, v. 5, p. 28–45.
- De Paor, D.G., 2016, Virtual rocks: GSA Today, v. 26, no. 8, p. 4–11, doi: 10.1130/GSATG257A.1.
- Gudgel, D., 2015, Color blindness may soon be treatable with a single injection: American Academy of Ophthalmology, 25 May 2015, http://www.aao.org/eye-health/news/color-blindness-may-be-treatable-single-injection (last accessed 29 Dec. 2016).
- Ishihara, S., 1917, Tests for color-blindness: Handaya, Tokyo, Hongo Harukichi.
- Light, A., and Bartlein, P.J., 2004, The end of the rainbow? Color schemes for improved data graphics: Eos, v. 85, no. 40, p. 385–391.
- Maule, L., and Featonby, D., 2016, Colour vision deficiency and physics teaching: Physics Education, v. 51, no. 3, p 035005.
- Nagel, W.A., 1907, Zwei Apparate für die Augenärzliche Funktionsprüfung. Adaptometer und kleines Spektralphotometer (Anomaloskop): Zeitschrift für Augenheilkunde, v. 17, p. 201–222.
- Okabe, M., and Ito, K., 2008, Color Universal Design (CUD)—How to make figures and presentations that are friendly to colorblind people: J* Fly, Data Depository for Drosophila Researchers, http://jfly.iam.u-tokyo.ac.jp/color/ (last accessed 29 Dec. 2016).
- Rao, S., and Gartin, B.C., 2003, Attitudes of university faculty toward accommodations to students with disabilities: The Journal for Vocational Special Needs Education, v. 25, p. 47–54.
- Saey, T.H., 2016, Color vision strategy defies textbook picture: Science News, v. 190, no. 8, p. 10.
- Shah, A., Hussain, R., Fareed, M., and Afzal, M., 2013, Prevalence of red-green color vision defects among Muslim males and females of Manipur, India: Iranian Journal of Public Health, v. 42, no. 1, p. 16.
- Wagner, M., Newman, L., Cameto, R., Garza, N., and Levine, P., 2005, After high school: A first look at the post-school experiences of youth with disabilities: National Longitudinal Transition Study-2, http://files.eric.ed.gov/fulltext/ED494935.pdf (last accessed 29 Dec. 2016).
