
Tower in Motion: Resonance Mode Analysis of Devils Tower, Wyoming, USA
Jeffrey R. Moore et al.

In this article
Authors
Jeffrey R. Moore*
University of Utah, Department of Geology & Geophysics, Salt Lake City, Utah 84112, USA
Kathryn Vollinger
Independent researcher, Leavenworth, Washington, USA
Jan Burjánek
Institute of Geophysics of the Czech Academy of Science, Prague, Czech Republic
Abstract
Devils Tower, Wyoming, is a 265-m-high cylindrical rock tower of phonolite porphyry with deep cultural significance and is the site of America’s first national monument. We deployed a seismometer on the summit of Devils Tower for 21 h in October 2024, in addition to two identical sensors at the base, and used ambient vibration modal analysis techniques to identify resonance modes. Close axial symmetry of the tower gives rise to similar frequencies for the first two modes at 1.1 and 1.2 Hz. We then performed 3-D numerical modeling to predict modal deformation fields: the first two predicted modes are full-height swaying of the tower in orthogonal directions, matching resonance frequencies from field data, followed by a third, torsional mode. The model derived a calibrated global Young’s modulus for the tower of 8 GPa, which is approximately seven times lower than that measured from intact rock testing due to the added compliance of joints. Our results contribute to a growing understanding of the structural dynamics of freestanding rock landforms with different sizes, geometry, and composition, and more generally to engaging public interest in geologic features of cultural heritage sites.
*jeff.moore@utah.edu
CITATION: Moore, J.R., et al., 2026, Tower in motion: Resonance mode analysis of Devils Tower, Wyoming, USA: GSA Today, v. 36, p. 4–9, https://doi.org/10.1130/GSATG635A.1.
© 2026 The Authors. Gold Open Access: This paper is published under the terms of the CC-BY-NC license. Printed in the USA.
Introduction
Freestanding structures at Earth’s surface are in constant motion, vibrating in response to wind, seismic energy, and anthropogenic forces (Carder, 1936; Cloud et al., 1952; Moore et al., 2019; Weber et al., 2022). These inputs excite the normal modes of the structure, resulting in resonance. While the dynamic properties of civil structures have been investigated for more than a century (e.g., Omori, 1900), similar research on geologic features is still an emerging field (Dowding et al., 1983; King, 2001; Geimer et al., 2020; Müller and Burjánek, 2023). However, past studies have shown that the dynamic properties of freestanding geologic landforms have important similarities to their civil counterparts (Finnegan et al., 2022a), and that techniques used in engineering can be applied to understand resonance of geologic features (Häusler et al., 2021).
Modal analysis is the process of determining the resonance properties of a structure from frequency-domain techniques (Fu and He, 2001). In the past it was necessary to excite vibration of structures at different frequencies and measure the resulting response; however, with advances in instrument technology it is now possible to use ambient seismic data for modal analysis (Cloud et al., 1952; Brownjohn et al., 2010). Typical approaches involve spectral analysis, identifying frequency peaks in comparison to nearby reference sites, site-to-reference spectral ratios, and polarization analysis (e.g., Geimer et al., 2020). More advanced techniques offer resolution of modes with close frequency spacing, show directional modal vectors preserving phase information, include rotational or six component tensor data, and allow processing of sensor arrays (Häusler et al., 2021; Dzubay et al., 2022; Grechi et al., 2024).
Recent studies have shown that the resonance properties of rock towers can be described using analytical expressions for a cantilever (Dowding et al., 1983; Bottelin et al., 2013; Finzi et al., 2020; Martin et al., 2020; Finnegan et al., 2022a). Tall towers in particular occupy an end member cantilever bending description utilizing Euler-Bernoulli beam theory, but towers of different aspect ratios can incorporate elements of shear deformation, as described by Timoshenko beam theory (Michel and Guéguen, 2018; García Suárez et al., 2025). Results of these studies are valuable for assessing resonance susceptibility and vibration-induced damage risks for geologic features with important cultural value (e.g., King, 2001). Similar studies have also assessed the dynamic properties of large mountain landforms, highlighting topographic amplification relevant for earthquake triggering of landslides (e.g., Weber et al., 2022).
Despite growing interest in the dynamic properties of rock landforms, most research is confined to studies of a few key rock types (often sandstone) and typical landform scales that allow in situ seismic measurement (Finnegan et al., 2022a). While such studies continue to expand and include new materials (e.g., Grechi et al., 2024), it is also important to analyze large-scale features with different geometries. Moreover, vibration analysis of cultural heritage sites, including geologic features of national parks and monuments, is important not only in developing approaches for long-term management and conservation, and in aiding vibration risk assessment (e.g., Dowding et al., 1983; Moore et al., 2016), but also can be valuable for public outreach to generate new interest in geologic features as dynamic at time scales concurrent with human perception and visitation.
Here we describe the dynamic properties of Devils Tower, a 265-m-high rock tower of intrusive igneous rock in northeastern Wyoming and the site of America’s first national monument. We deployed a broadband seismometer on the summit of Devils Tower for 21 h in October 2024, and two other identical instruments at its base for comparison. Data indicate two closely spaced first resonance modes at 1.1 and 1.2 Hz. With the aid of calibrated numerical modeling, we show the predicted deformation fields for these modes and derive a global Young’s modulus for the tower, which we compare with lab-measured values on core samples. Our results expand understanding of the resonance properties of rock landforms and provide a new means of visitor outreach describing Devils Tower as a dynamic landform constantly in motion, swaying in resonance with Earth’s forces.
Figure 1
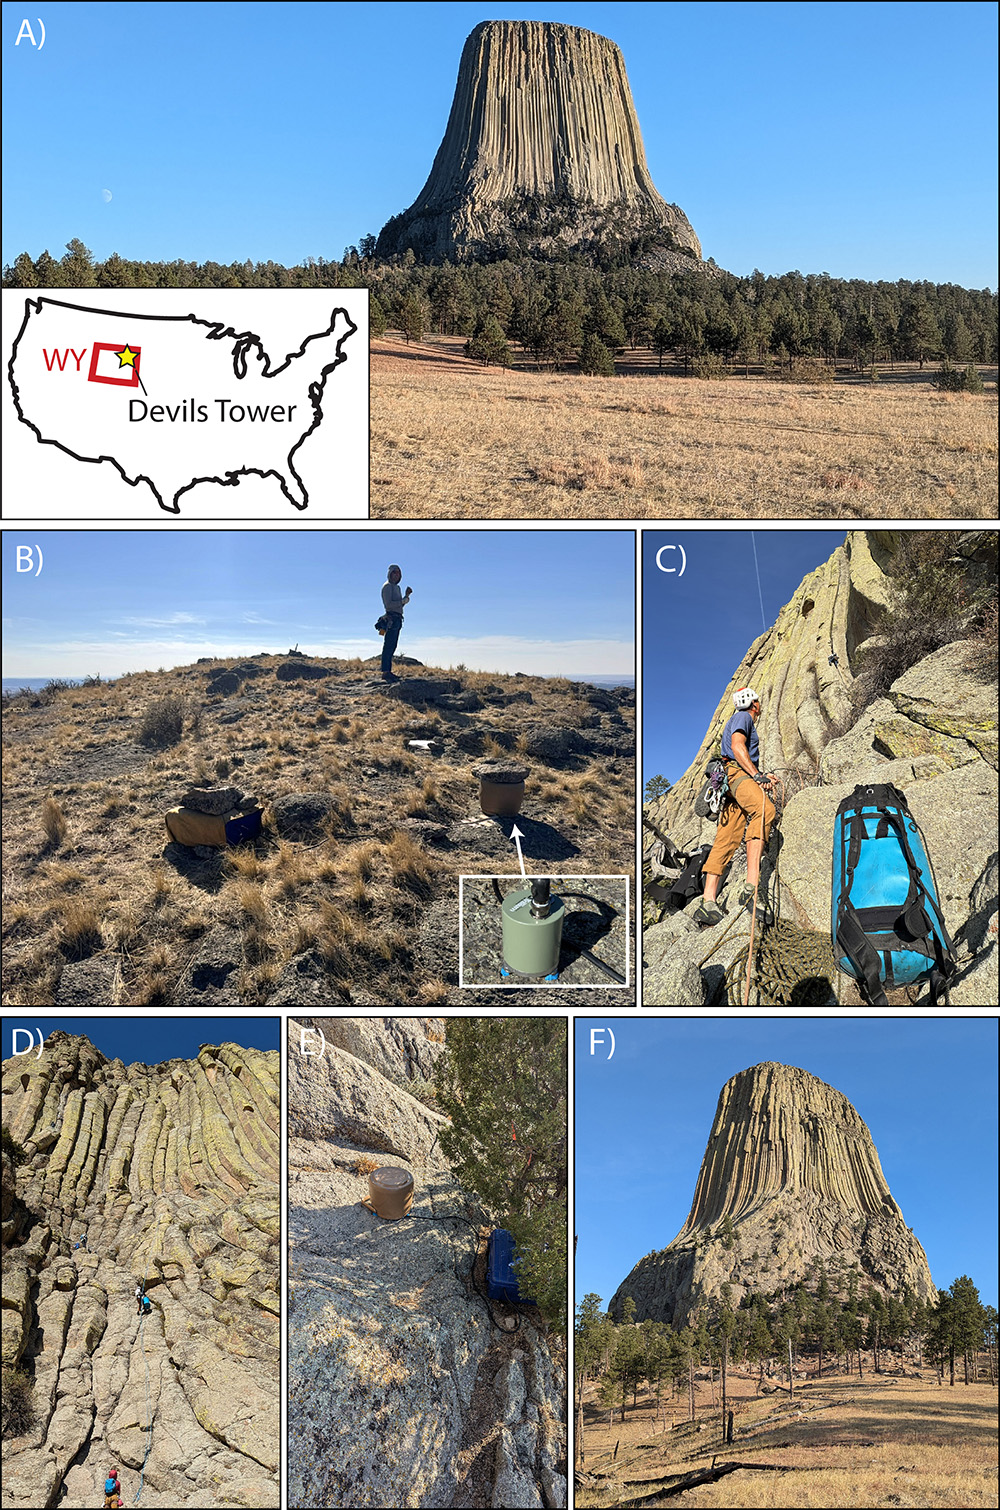
Photographs of Devils Tower and seismometer deployments. (A) Tower with view toward east-southeast (location inset); (B) view from the summit looking south showing seismometer under bucket (detail inset), covered data logger, and battery under tarp; climbers (C) hauling seismometer to the summit and (D) rappelling with equipment; (E) Station C at the base of the south cliff; (F) Devils Tower looking north.
Study Site and Experiment
Devils Tower is a ~265-m-high monolith of Cenozoic phonolite porphyry rising from surrounding Jurassic sedimentary rocks in northeastern Wyoming (Fig. 1). The iconic prominence of the tower, as well as its characteristic columnar jointing, have helped make it an important cultural site for millennia. Local Indigenous people refer to the tower as Bear Lodge (or similar variants thereof), while the name change to Devils Tower arose in the early 1900s, possibly stemming from a mistranslation (Rogers, 2007). The site was designated as America’s first national monument in 1906. Different theories exist as to the formation of the intrusive igneous body, whether it be a stock, laccolith remnant, volcanic plug, or lava coulee (see Závada et al., 2015). Today the site is a popular tourist attraction.
We deployed a Nanometrics Trillium Compact 20-s, three-component broadband seismometer on the summit of Devils Tower from 12–13 October 2024 (Fig. 1). The instrument was carried to the summit by a team of climbers under an approved permit from the National Park Service. The seismometer (station D) was located on the northern portion of the tower summit (Fig. 2A). It was placed on bedrock, with a dab of adhesive putty under each foot to aid coupling, leveled and oriented north, and then covered to prevent wind buffeting. The seismometer was paired with a 24-bit Nanometrics Centaur datalogger recording continuous data at 100 Hz. Two identical seismometer setups were additionally deployed (Fig. 2A): station C on bedrock at the base of the tower’s south wall, and station A on a large flat boulder embedded in colluvium ~200 m south of the tower. The various instruments had different run times: station D ran the longest for 21 h from afternoon to late morning, while the overlapping duration of all three sensors was 19 h (12 Oct. 20:00–13 Oct. 15:00 UTC).
Figure 2
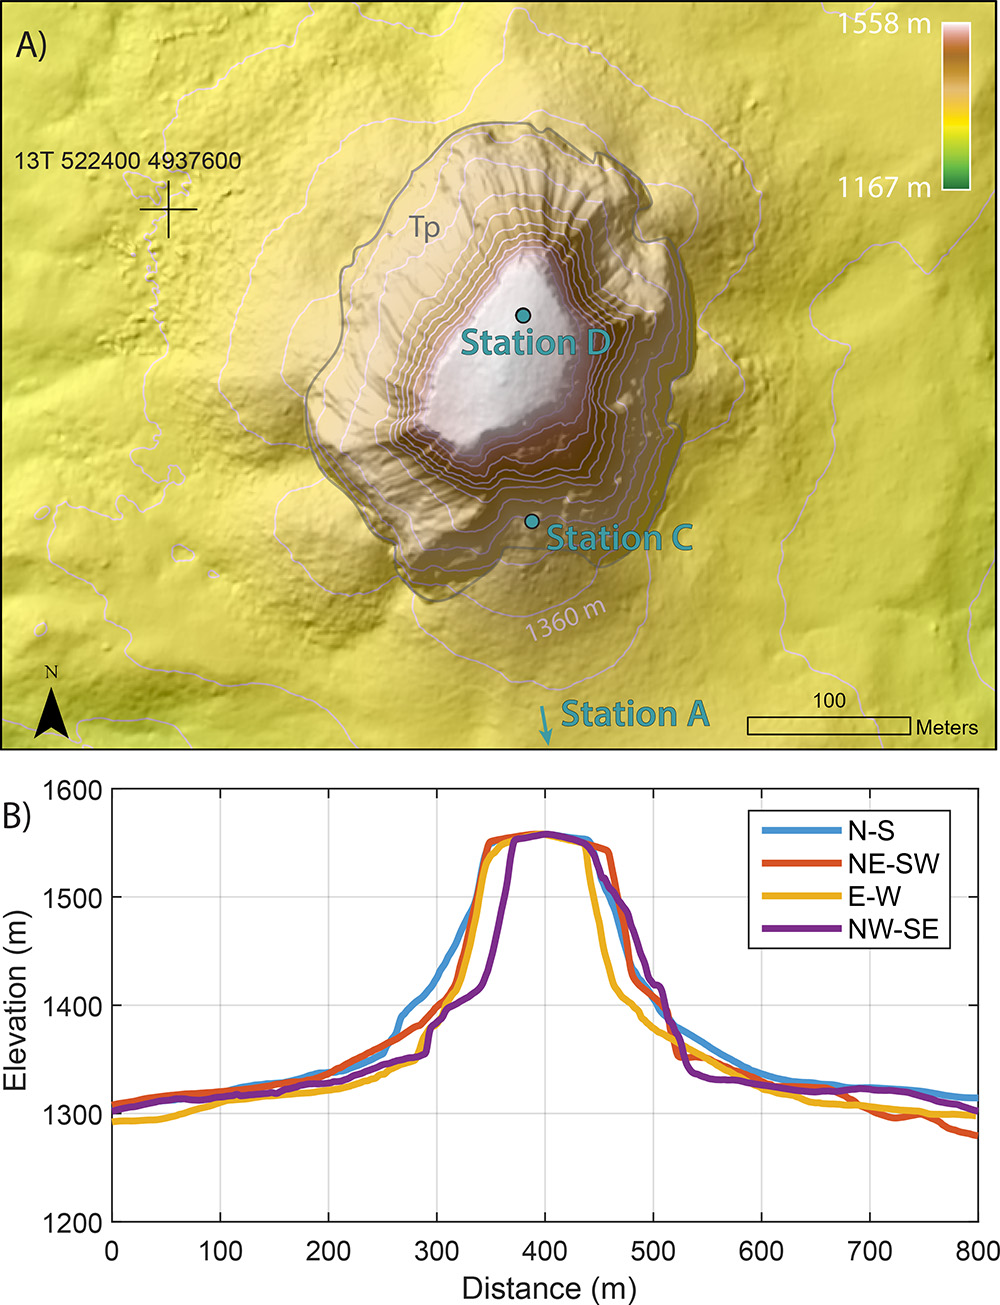
Topography of Devils Tower. (A) Hillshade with elevation coloring, contour interval is 20 m. UTM coordinate given for reference. Layout of three seismic stations shown. Tp: phonolite porphyry; (B) topographic profiles at 45° azimuth intervals showing radial similarity of the cross-profile. The slimmest aspect is the E-W direction while the thickest is N-S. Source: USGS 1-m LiDAR.
Methods
We processed continuous seismic data for spectral information using the approach of Finnegan et al. (2022a). We removed the mean, trend, and instrument response from each trace, then band-pass filtered data between 0.1 and 40 Hz and computed power spectral density curves using fast Fourier transforms in overlapping 5-min windows. We additionally used Frequency Domain Decomposition (FDD; Brinker and Ventura, 2015), which is a modal analysis technique used to identify natural frequencies, mode shapes, and damping ratios from ambient vibration data. FDD decomposes the cross-power spectral density matrix of recorded signals via eigenvalue decomposition, with peaks in the first eigenvalues indicating dominant modes and corresponding eigenvectors describing their shapes (Poggi et al., 2014; Labuta et al., 2025).
We used the commercial finite-element software COMSOL Multiphysics to perform 3-D eigenfrequency simulations (i.e., solved in the frequency-domain, no input motion applied). Models require accurate representation of topography, which we obtained from a USGS 1-m LiDAR digital elevation model (Fig. 2), in addition to specified material properties. Following the approach of Moore et al. (2018), we set density at 2600 kg/m3, representing unweathered phonolite porphyry (likely accurate to within ± 10%), and let Young’s modulus vary until a close match was found to resonance frequencies identified from experimental data. The surrounding country rock was not independently described as this material has negligible effect on modal deformation of the tower.
Laboratory rock strength and deformation testing were performed according to ASTM D7012 standards. We obtained a fresh phonolite porphyry boulder from the scree slope at the base of Devils Tower and extracted three 3.8-cm-diameter cores with lengths between 8.4 and 8.7 cm. Core specimens were prepared for testing following ASTM D4543, with ends machined flat and parallel and an axial strain gauge affixed, then loaded in an unconfined state until failure. Young’s modulus was determined as the slope of the stress-strain curve at 50% strength (ASTM D7102), and the uniaxial compressive strength was determined as the stress at sample failure.
Figure 3
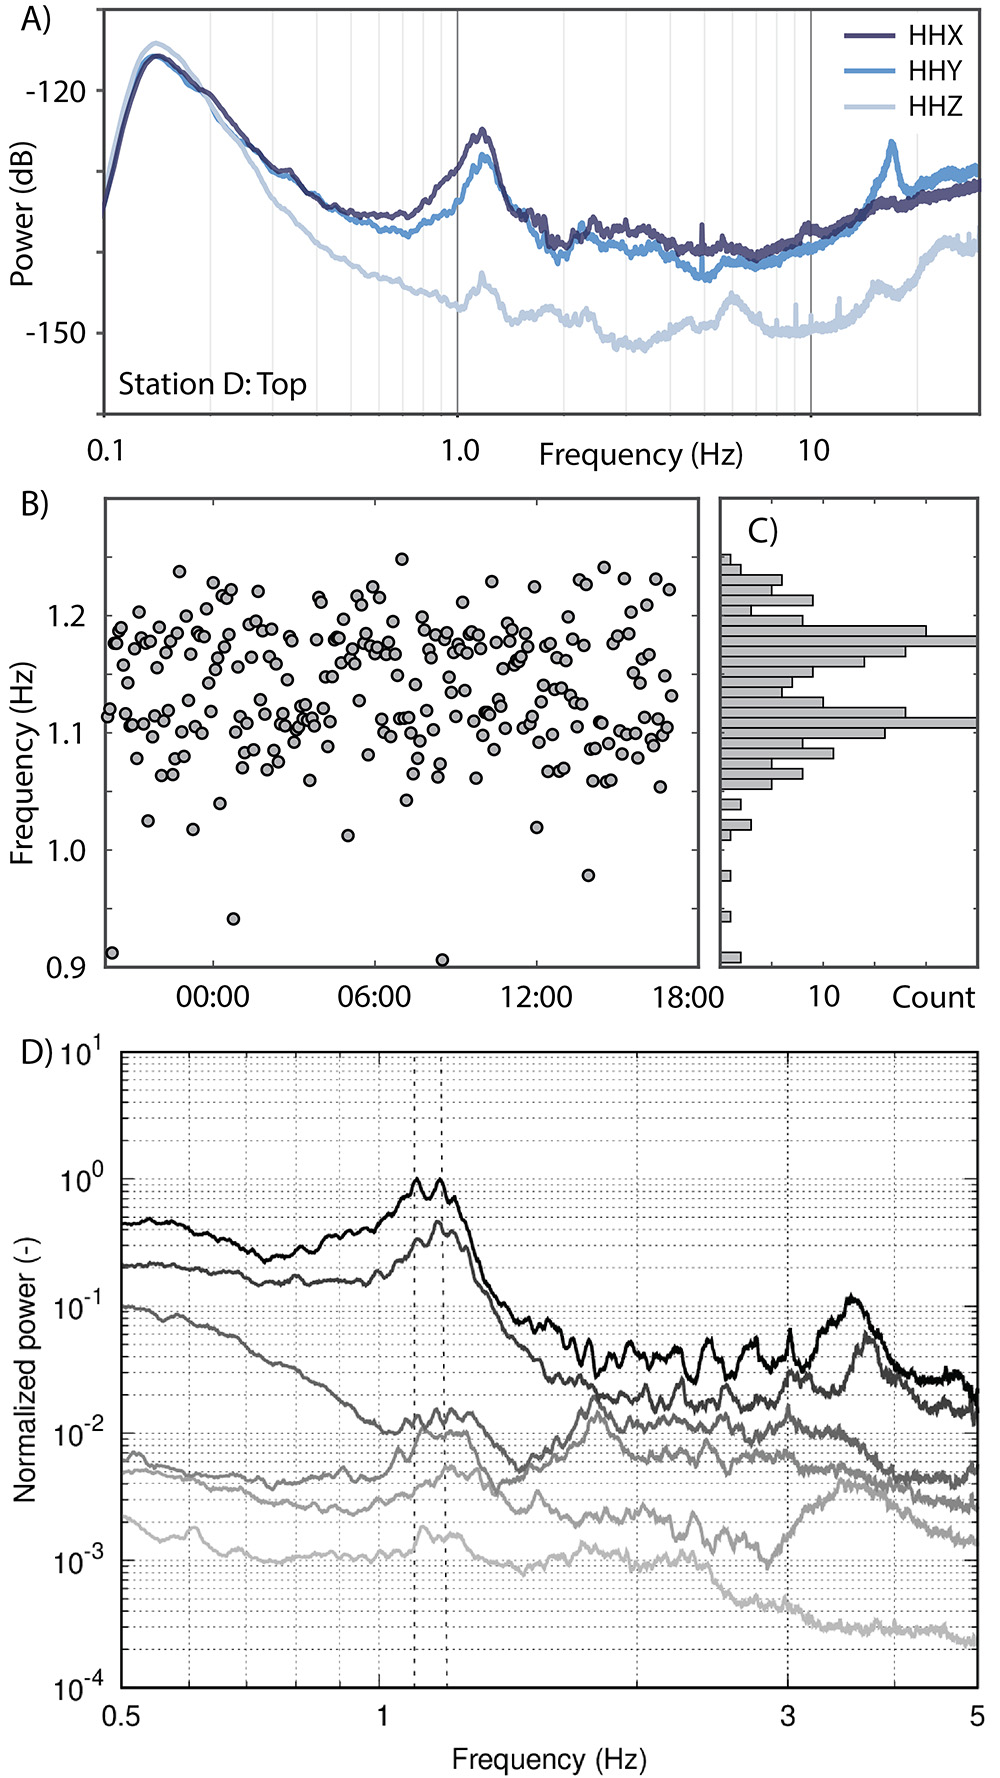
Spectral attributes of seismic data. (A) Power spectral density; power in decibels relative to unit acceleration; (B) frequency with peak power extracted in 5-min windows over time; (C) histogram of frequency data; (D) FDD results for joint analysis of stations A and D showing six frequency-dependent eigenvalues (in grayscale) of the cross-spectral density matrix. Dashed lines are 1.1 and 1.2 Hz.
Results
Spectral analysis of ambient vibration data from the Devils Tower summit station shows a prominent peak around 1.1 Hz (Fig. 3A), which is strongest on the horizontal components of motion (HHX and HHY) and similarly seen on spectra from station C at the base of the tower (see also Fig. S1 in the Supplemental Material1). We interpret this peak as relating to a resonance mode of Devils Tower. Other higher frequency spectral peaks are also apparent. Additionally, we observed a strong peak at ~0.15 Hz, which is seismic energy created by the world’s oceans and measured equally across all stations (Longuet-Higgins, 1950). Modal displacements at the summit station at 1.1 Hz were ~0.5 μm at maximum during a windy period, and most often one order of magnitude lower during calm periods under ambient seismic excitation.
Close inspection of the 1.1 Hz peak indicates subtle differences between the E-W horizontal component (HHX) and the N-S (HHY), with the latter appearing slightly offset to higher frequency (Fig. 3A). To clarify, we extracted the frequency with peak power in the band between 0.9 and 1.3 Hz for 5-min windows over all 21 available hours (Fig. 3B). Results show that the dominant spectral peak switches randomly between 1.1 and 1.2 Hz, which is clarified by the histogram in Figure 3C, where the two frequencies are clearly distinguished with equal count. This suggests that there are actually two spectral peaks representing two resonance modes of the tower at ~1.1 and 1.2 Hz. We identified no drifts in these frequencies over time, which can accompany temperature changes and/or freezing pore water in the near surface (e.g., Geimer et al., 2022).
We applied FDD analysis in an attempt to discern properties of resonance modes with similar frequency. FDD confirmed two closely spaced peaks at 1.1 and 1.2 Hz (Fig. 3D). Particle motion associated with the 1.1 Hz mode is oriented EEN–WWS and appears elliptical rather than linear (Fig. S2), as is typically expected, while the 1.2 Hz mode shows a similar directional pattern. Based on previous observations at rock towers, the 1.2 Hz mode shape is expected to be oriented perpendicular to the 1.1 Hz mode, which is also suggested by a peak in the second eigenvalue between 1.0 and 1.3 Hz. However, properties of the perpendicular mode cannot be identified from the first eigenvalue. FDD analysis also revealed several local maxima between 1.7 and 5 Hz (Fig. 3D), including a peak at 2 Hz that appears significant as suggested by characteristic shapes observed in the third, fourth, and fifth eigenvalues.
Numerical modal analysis allowed us to test the hypothesis that experimental data resolve resonance modes of Devils Tower. We implemented a 3-D uniform, isotropic model of Devils Tower in COMSOL Multiphysics for eigenfrequency analysis. Assuming a constant density of 2600 kg/m3, we found a Young’s modulus of 8 GPa produced results closely matching field data: the model predicts the first two resonance frequencies of Devils Tower are 1.1 and 1.2 (Fig. 4), matching measurements. The model also predicts a third mode at 2.1 Hz, similar to that evident in FDD analysis. Modeled mode shapes for the first two modes indicate full-height deformation in roughly orthogonal directions (approximately E-W for the first, N-S for the second), with the third torsional mode showing the tower rotating about a vertical axis.
Figure 4
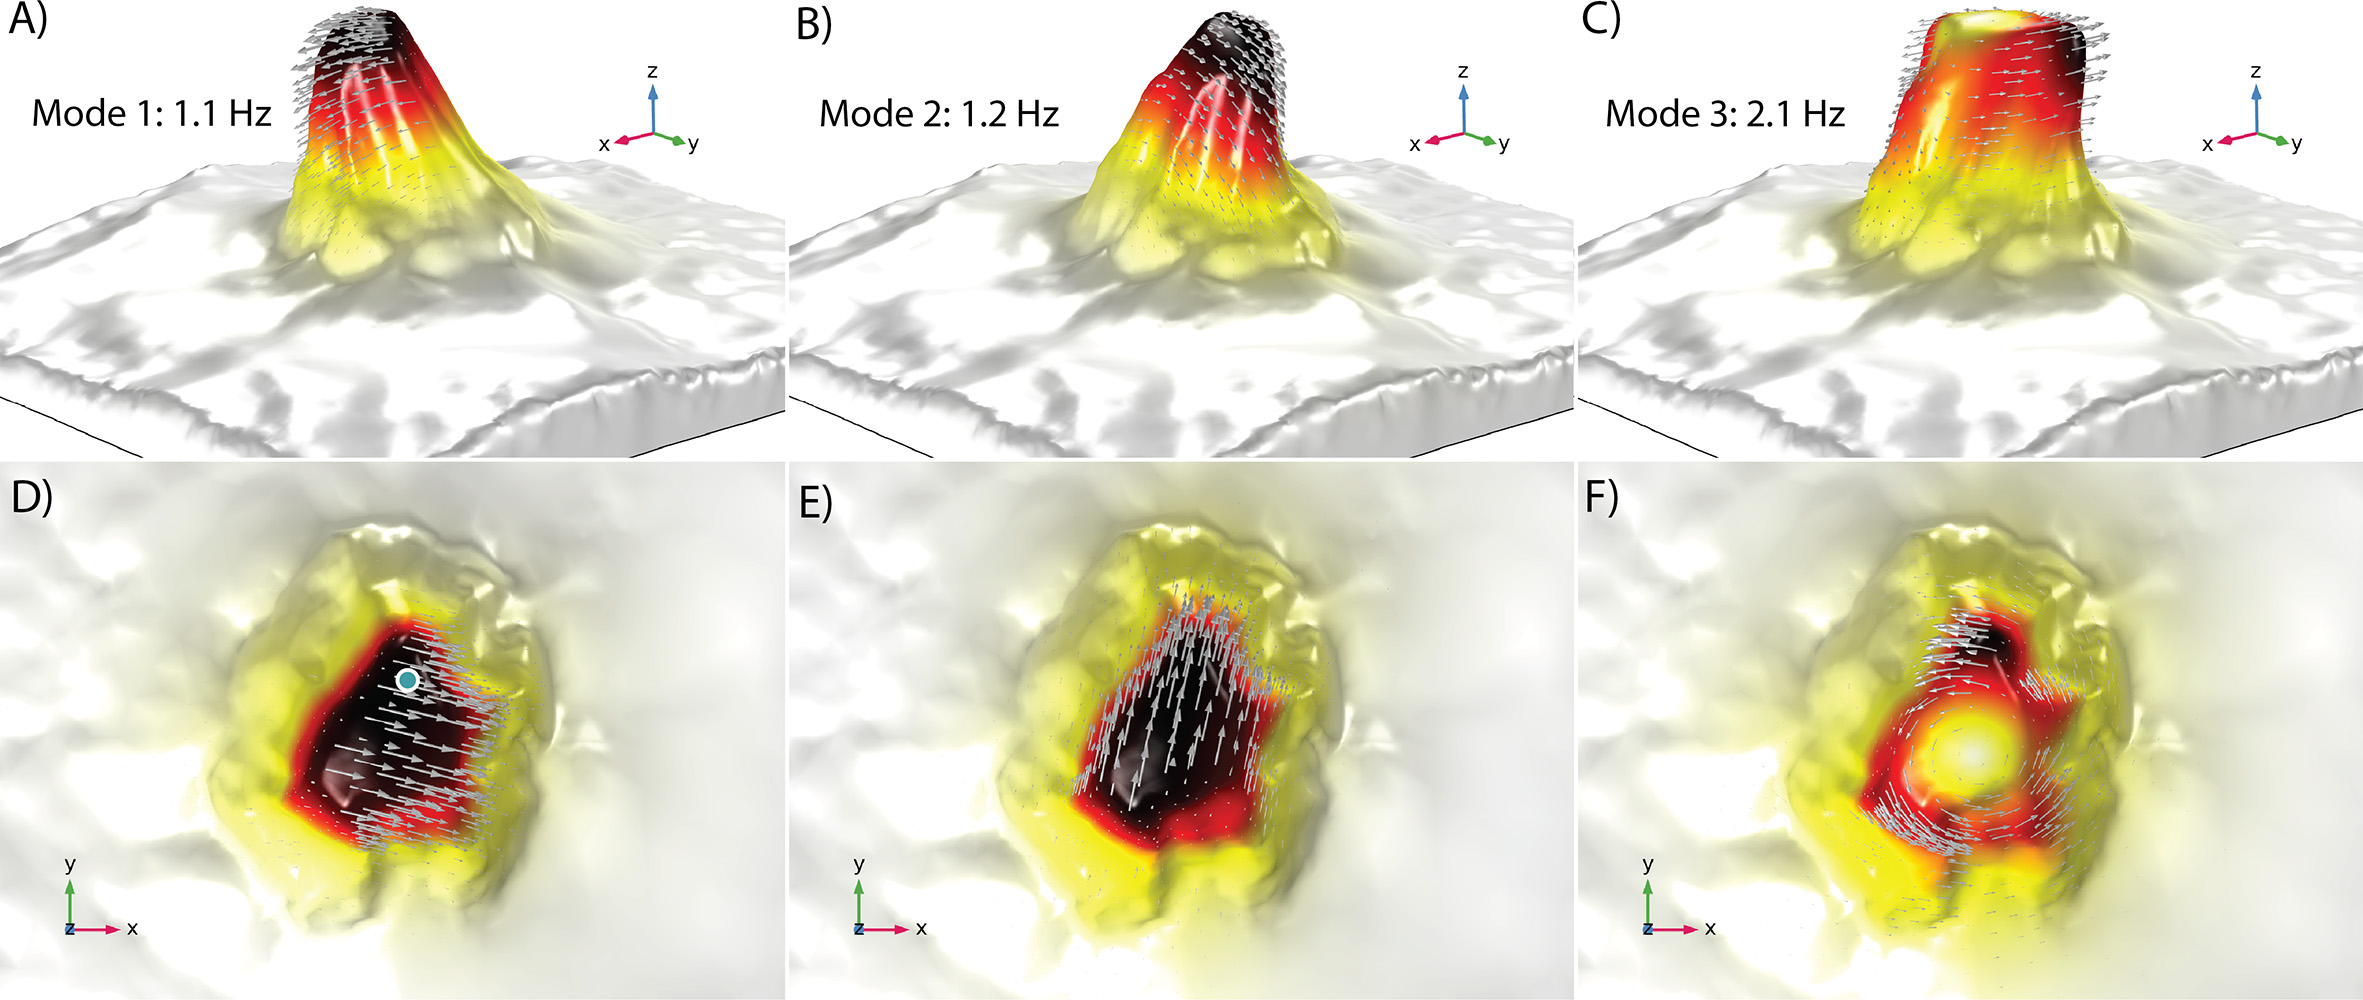
Numerical modal analysis. (A–C) First three predicted resonance modes of Devils Tower showing exaggerated modal deflection (view looking southwest; y = north, x = east). Color scale and arrows show relative modal displacement (black greatest, white zero); (D–F) map view of undeformed displacement vectors; green dot is seismometer location.
Discussion
Experimental and numerical modal analysis shows that the first two resonance modes of Devils Tower are full-height deformation likely in orthogonal directions (Fig. 4). This sequence is common for rock towers (e.g., Moore et al., 2019; Finnegan et al., 2022a; Müller and Burjánek, 2023; García Suárez et al., 2025; Jbara and Tsesarsky, 2025). However, notable at Devils Tower is the close similarity of the first two resonance frequencies, which arises due to the near-axial symmetry of the tower’s form (cf. Cloud et al., 1952) and is clarified in Figure 2B. With perfect axial symmetry, the two modes would be at identical frequencies. However, the tower is slightly slimmer in the E-W direction (modeled orientation of motion for the first mode), and thicker in the N-S direction (modeled orientation of motion for the second mode).
The third resonance mode predicted for Devils Tower from numerical modeling is torsion with rotational motion about a vertical axis. This sequence of modes is also relatively common for other rock towers (e.g., Michel et al., 2010; García Suárez et al., 2025). Dzubay et al. (2022) noted similar observations for a ~30-m-high sandstone tower in Utah, where the first two modes were mutually orthogonal bending and the third was torsion, and confirmed the torsional mode using a rotational seismometer. In a study of a broad range of tower and fin landforms, Finnegan et al. (2022a) noted that geometry plays a key role in controlling the progression of mode shapes, with semi-symmetrical towers typically having two orthogonal first-order modes followed by torsion. The third mode at Devils Tower is only weakly apparent in spectral analysis, possibly due to a lack of strong excitation.
FDD analysis indicates the presence of multiple modes in the 1.1–1.3 Hz range, with a peak in the second eigenvalue suggesting an orthogonal mode. The absence of an expected perpendicular mode shape in the first eigenvalue indicates a more complex modal structure, where the fundamental mode is split into closely spaced components. This multiplet likely overlaps with the 1.2 Hz mode, complicating mode shape estimation. An alternative explanation is that the second mode is only weakly excited and the fundamental mode dominates the observed response. Careful selection of time windows reveals multiple sub-peaks in the eigenvalues; however, the limited number of time windows reduces the robustness of this approach. The peak close to 2 Hz likely corresponds to the torsional mode predicted by numerical modeling, as suggested by its characteristic signature in the higher-order eigenvalues. More reliable characterization of higher modes would require a dense array of measurements across the tower.
Results from numerical modeling closely matched experimental field data, with nearly identical resonance frequencies predicted versus measured for the first two modes, despite the simplified uniform composition. This implies the tower can generally be considered monolithic, which is not surprising given theories on its genesis (Závada et al., 2015).
In a previous study of the Matterhorn, Weber et al. (2022) hypothesized that implementing a stress-dependent Young’s modulus might be more appropriate for large-scale landforms where modulus increases at higher confining pressures at depth; however, their tests did not reveal substantial differences to a uniform model nor an improved fit to field data. Thus, we elected to use the simplified uniform modeling approach. We also did not treat the surrounding sedimentary rock units as independent material in the model as these areas do not affect predictions for the tower.
The model-calibrated Young’s modulus of 8 GPa for Devils Tower represents a mean effective value for the rock mass. While derived from small-strain measurements, the value appears to better represent one we might expect for large strains in engineering applications, where the rock mass modulus is less than that of intact rock due to the added compliance of joints (Moore et al., 2018; Müller and Burjánek, 2023). To clarify, we measured the Young’s modulus of phonolite porphyry core samples from Devils Tower using standard laboratory techniques (see Fig. S3). The mean value determined was 55 GPa (range: 48–66 GPa), which is ~7 times greater than that of our numerical model. For comparison, Moore et al. (2018) assessed similar data sets for Navajo Sandstone arches and found that resonance-based modulus estimates were 2–5 times lower than intact rock values.
The large difference between rock mass and intact moduli results from the compliance of joints, such as the vertical columnar joints that are a well-known feature of Devils Tower, which cannot be captured by laboratory measurements on small samples. Using the approach of Hoek and Diederichs (2006) and Grechi et al. (2024), we investigated use of the disturbance factor (D) to scale between intact and rock mass moduli. We found that a relatively large disturbance factor of 0.7–1 is required to match our values. While the parameter is normally applied in smaller-scale engineering studies, its use is intended to account for joint dilation and added joint compliance, which is applicable in our study. The result suggests that the bulk of the rock mass at Devils Tower contains dilated joints, even at depth. This may arise from the particular stress conditions and lack of confinement at the freestanding tower.
Past studies on rock landforms, including rock towers, cave formations, and cliff blocks, have found that the fundamental resonance modes of these features conform to that of a cantilever beam (Finnegan et al., 2022a). When validated, such comparisons mean that resonance frequencies and modal strain fields can be predicted from analytical solutions, which is valuable when field data are difficult to acquire. At Devils Tower, if we simply apply approximate geometrical properties (height: 250 m, width: 250 m) in the Euler-Bernoulli cantilever equation (Moore et al., 2019) and use the value of 8 GPa for Young’s modulus determined from numerical modeling, we calculate a first resonance frequency of 1.1 Hz, close to our measured value. However, we note that a priori estimates of Young’s modulus are rarely available for all materials and feature scales, which remains a key output of this analysis.
Normal mode vibration of a cantilever is not always best described by the Euler-Bernoulli model, which is appropriate for slender towers and an end member of more generalized Timoshenko beam theory (García Suárez et al., 2025). Shorter towers, on the other hand, incorporate important components of shear deformation. Boutin et al. (2005) and Michel and Guéguen (2018) developed a parameter, C, that relates the ratio of bending stiffness to shear stiffness to assess the importance of each in the deformation at various modes. C values <~0.01 indicate bending dominates while C >~1.0 indicates shear dominates. We found that the C value for Devils Tower, where the height and width are similar, is ~0.5, suggesting that modal deformation consists of a mix of bending and shear.
Results of our study are valuable in understanding the structural dynamics of freestanding rock landforms with different sizes, geometry, and composition. This information is useful for assessing risks from vibration-induced damage (e.g., Dowding et al., 1983; King, 2001; Moore et al., 2016; Finnegan et al., 2022b) or predicting co-seismic rockfalls and requires a growing number of field-based data sets. Equally valuable, and especially relevant at Devils Tower, our study helps create a new way for visitors to experience the landform—not only as a geologic structure evolving slowly over millions of years, but as a dynamic and lively landform constantly in motion at human timescales (Figure S4; Animation S1; Audio S1). While the movements are small, they are nonetheless a real part of the story of Devils Tower, and their knowledge may help visitors better appreciate the delicacy and sensitivity of geologic landforms.
Conclusion
Devils Tower vibrates at a set of identifiable resonance modes, excited by ambient forces such as wind and seismic energy. We deployed a seismometer overnight on the summit of Devils Tower, as well as two identical instruments at and near its base, and used frequency-domain modal analysis techniques to identify the resonance modes. We found the fundamental mode of Devils Tower occurs at 1.1 Hz, with a second mode at 1.2 Hz. The close frequency spacing arises from the relatively close axial symmetry of the cylindrical tower. We implemented the geometry of Devils Tower in a simplified numerical model in an attempt to replicate field observations. Results captured the fundamental mode and predicted a second perpendicular mode, with frequencies closely matching field data, and in addition predicted the third torsional mode that was evident from FDD analysis. Tuning material properties to match measured frequencies, we determined a calibrated global Young’s modulus for the tower of 8 GPa, a value that is ~7 times lower than measured from intact rock testing, which results from the added compliance of joints at the rock mass scale. Our study contributes to better understanding of the dynamics of freestanding rock landforms with different scale and composition, and to engaging public interest in geologic features of national heritage sites.
1 Supplemental Material. Figure S1. Power spectral density plots for all stations. Figure S2. Particle motion for the first two modes. Figure S3. Results of laboratory rock testing. Figure S4. Visualized second mode of vibration. Animation S1. Modal animations. Audio S1. Sonified vibration of Devils Tower. Please visit https://doi.org/10.1130/GSAT.S.31366117 to access the supplemental material; contact editing@geosociety.org with any questions.
Acknowledgments
We are grateful for climbing assistance from Cameron Reade and Greg Dooley, and to the National Park Service for permitting this research. Thanks to Dan Seely at IGES Inc. for performing rock testing, Wil Mace for coring assistance, Paul Geimer for preparing topographic data, and Mauro Häusler for discussions on data analysis. This material is based on work supported by the National Science Foundation under Award No. 2150896. Data generated are available through the University of Utah HIVE repository: https://doi.org/10.7278/S5d-ajvn-wqqq.
References Cited
- Bottelin, P., Levy, C., Baillet, L., Jongmans, D., and Gueguen, P., 2013, Modal and thermal analysis of Les Arches unstable rock column (Vercors massif, French Alps): Geophysical Journal International, v. 194, no. 2, p. 849–858, https://doi.org/10.1093/gji/ggt046.
- Boutin, C., Hans, S., Ibraim, E., and Roussillon, P., 2005, In situ experiments and seismic analysis of existing buildings. Part II: Seismic integrity threshold: Earthquake Engineering & Structural Dynamics, v. 34, no. 12, p. 1531–1546, https://doi.org/10.1002/eqe.503.
- Brincker, R., and Ventura, C., 2015, Introduction to Operational Modal Analysis: Hoboken, New Jersey, Wiley, https://doi.org/10.1002/9781118535141.
- Brownjohn, J.M.W., Magalhaes, F., Caetano, E., and Cunha, A., 2010, Ambient vibration re-testing and operational modal analysis of the Humber Bridge: Engineering Structures, v. 32, no. 8, p. 2003–2018, https://doi.org/10.1016/j.engstruct.2010.02.034.
- Carder, D.S., 1936, Observed vibrations of buildings: Bulletin of the Seismological Society of America, v. 26, no. 3, p. 245–277, https://doi.org/10.1785/BSSA0260030245.
- Cloud, W.K., Hershberger, J., and Warner, S.E., 1952, Vibration observations, Sather Tower, University of California, Berkeley, California: Bulletin of the Seismological Society of America, v. 42, no. 1, p. 1–7, https://doi.org/10.1785/BSSA0420010001.
- Dowding, C.H., Kendorski, F.S., and Cummings, R.A., 1983, Response of rock pinnacles to blasting vibrations and airblasts: Bulletin of the Association of Engineering Geologists, v. 20, no. 3, p. 271–281, https://doi.org/10.2113/gseegeosci.xx.3.271.
- Dzubay, A., Moore, J.R., Finnegan, R., Jensen, E.K., Geimer, P.R., and Koper, K.D., 2022, Rotational components of normal modes measured at a natural sandstone tower (Kane Springs Canyon, Utah, USA): The Seismic Record, v. 2, no. 4, p. 260–268, https://doi.org/10.1785/0320220035.
- Finnegan, R., Moore, J.R., Geimer, P.R., Dzubay, A., Bessette‐Kirton, E.K., Bodtker, J., and Vollinger, K., 2022a, Ambient vibration modal analysis of natural rock towers and fins: Seismological Research Letters, v. 93, no. 3, p. 1777–1786, https://doi.org/10.1785/0220210325.
- Finnegan, R., Moore, J.R., and Geimer, P.R., 2022b, Contribution of anthropogenic vibration sources to crack growth in natural rock arches: Frontiers of Earth Science, v. 10, https://doi.org/10.3389/feart.2022.1035652.
- Finzi, Y., Ganz, N., Dor, O., Davis, M., Volk, O., Langer, S., Arrowsmith R., and Tsesarsky, M., 2020, Stability analysis of fragile rock pillars and insights on fault activity in the Negev, Israel: Journal of Geophysical Research: Solid Earth, v. 125, no. 12, https://doi.org/10.1029/2019JB019269.
- Fu, Z.F., and He, J., 2001, Modal Analysis: Amsterdam, Elsevier, 304 p.
- García Suárez, J., McPhillips, D., and Asimaki, D., 2025, Seismic response of rock towers at the Trona Pinnacles (USA) to the 2019 Ridgecrest earthquake sequence: Theory, observations, and models: Bulletin of the Seismological Society of America, v. 115, no. 6, p. 2769–2792, https://doi.org/10.1785/0120250073.
- Geimer, P.R., Finnegan, R., and Moore, J. R., 2020, Sparse ambient resonance measurements reveal dynamic properties of freestanding rock arches: Geophysical Research Letters, v. 47, no. 9, https://doi.org/10.1029/2020GL087239.
- Geimer, P.R., Finnegan, R., and Moore, J. R., 2022, Meteorological controls on reversible resonance changes in natural rock arches: Journal of Geophysical Research: Earth Surface, v. 127, no. 10, https://doi.org/10.1029/2022JF006734.
- Grechi, G., Moore, J.R., Jensen, E.K., McCreary, M.E., Czech, T.L., and Festin, M.M., 2024, Modal analysis of a lava tube roof complex: Tabernacle Hill, Utah, USA: Rock Mechanics and Rock Engineering, v. 57, p. 1–10, https://doi.org/10.1007/s00603-024-03868-9.
- Häusler, M., Geimer, P.R., Finnegan, R., Fäh, D., and Moore, J.R., 2021, An update on techniques to assess normal-mode behavior of rock arches by ambient vibrations: Earth Surface Dynamics, v. 9, no. 6, p. 1441–1457, https://doi.org/10.5194/esurf-9-1441-2021.
- Hoek, E., and Diederichs, M.S., 2006, Empirical estimation of rock mass modulus: International Journal of Rock Mechanics and Mining Sciences, v. 43, no. 2, p. 203–215, https://doi.org/10.1016/j.ijrmms.2005.06.005.
- Jbara, A., and Tsesarsky, M., 2025, Dynamic fragility of a slender rock pillar in a carbonate rock mass: Natural Hazards and Earth System Sciences, v. 25, no. 7, p. 2197–2213, https://doi.org/10.5194/nhess-25-2197-2025.
- King, K.W., 2001, Chiricahua pinnacle vibration investigation: Preliminary report for Chiricahua National Monument, Lakewood, Colorado, EGU.
- Labuta, M., Oprsal, I., Landa, D.A., and Burjánek, J., 2025, Ambient vibrations of a deep maar resonator: Soil Dynamics and Earthquake Engineering, v. 188, p. 109072, https://doi.org/10.1016/j.soildyn.2024.109072.
- Longuet-Higgins, M.S., 1950, A theory of the origin of microseisms: Philosophical Transactions of the Royal Society of London, Series A, Mathematical and Physical Sciences, v. 243, no. 857, p. 1–35, https://doi.org/10.1098/rsta.1950.0012.
- Martin, A., Lecocq, T., Hinzen, K.G., Camelbeeck, T., Quinif, Y., and Fagel, N., 2020, Characterizing stalagmites’ eigenfrequencies by combining in situ vibration measurements and finite element modeling based on 3D scans: Geosciences, v. 10, no. 10, p. 418, https://doi.org/10.3390/geosciences10100418.
- Michel, C., and Guéguen, P., 2018, Interpretation of the velocity measured in buildings by seismic interferometry based on Timoshenko beam theory under weak and moderate motion: Soil Dynamics and Earthquake Engineering, v. 104, p. 131–142, https://doi.org/10.1016/j.soildyn.2017.09.031.
- Michel, C., Guéguen, P., El Arem, S., Mazars, J., and Kotronis, P., 2010, Full‐scale dynamic response of an RC building under weak seismic motions using earthquake recordings, ambient vibrations and modelling: Earthquake Engineering & Structural Dynamics, v. 39, no. 4, p. 419–441, https://doi.org/10.1002/eqe.948.
- Moore, J.R., Thorne, M.S., Koper, K.D., Wood, J.R., Goddard, K., Burlacu, R., Doyle, S., Stanfield, E., and White, B., 2016, Anthropogenic sources stimulate resonance of a natural rock bridge: Geophysical Research Letters, v. 43, no. 18, https://doi.org/10.1002/2016GL070088.
- Moore, J.R., Geimer, P.R., Finnegan, R., and Thorne, M.S., 2018, Use of seismic resonance measurements to determine the elastic modulus of freestanding rock masses: Rock Mechanics and Rock Engineering, v. 51, p. 3937–3944, https://doi.org/10.1007/s00603-018-1554-6.
- Moore, J.R., Geimer, P.R., Finnegan, R., and Michel, C., 2019, Dynamic analysis of a large freestanding rock tower (Castleton Tower, Utah): Bulletin of the Seismological Society of America, v. 109, no. 5, https://doi.org/10.1785/0120190118.
- Müller, J., and Burjánek, J., 2023, In situ estimation of effective rock elastic moduli by seismic ambient vibrations: International Journal of Rock Mechanics and Mining Sciences, v. 170, https://doi.org/10.1016/j.ijrmms.2023.105459.
- Omori, F., 1900, Earthquake measurement in a brick building: Public Earthquake Investigation Committee in Foreign Languages, v. 4, p. 7–11.
- Poggi, V., Ermert, L., Burjanek, J., Michel, C., and Fäh, D., 2014, Modal analysis of 2-D sedimentary basin from frequency domain 382 decomposition of ambient vibration array recordings: Geophysical Journal International, v. 200, no. 1, p. 615–626, https://doi.org/10.1093/gji/ggu420.
- Rogers, J., 2007, Standing Witness: Devils Tower National Monument: National Park Service, 289 p.
- Weber, S., Beutel, J., Häusler, M., Geimer, P.R., Fäh, D., and Moore, J.R., 2022, Spectral amplification of ground motion linked to resonance of large-scale mountain landforms: Earth and Planetary Science Letters, v. 578, https://doi.org/10.1016/j.epsl.2021.117295.
- Závada, P., Dědeček, P., Lexa, J., and Keller, G.R., 2015, Devils Tower (Wyoming, USA): A lava coulée emplaced into a maar-diatreme volcano?: Geosphere, v. 11, no. 2, p. 354–375, https://doi.org/10.1130/GES01166.1.
