

In this article
Authors
Greg M. Stock1, Antoine Guerin2, Nikita Avdievitch1, Brian D. Collins3, Michel Jaboyedoff2
1 National Park Service, Yosemite National Park, El Portal, California 95318, USA
2 Risk Analysis Group, Institute of Earth Sciences, University of Lausanne, Lausanne, Switzerland
3 U.S. Geological Survey, Menlo Park, California 94025, USA
Introduction
On the afternoon of 27 Sept. 2017, thousands of visitors to Yosemite National Park were enjoying scenic attractions in Yosemite Valley. Dozens of rock climbers were scaling El Capitan, a 900-m-tall granitic cliff famous for its challenging climbing routes. Suddenly, at 13:51 Pacific Standard Time (PST), a rock slab detached from 230 m up the southeast face of El Capitan. Tragically, rock debris struck two rock climbers walking along the base of the cliff, killing one and seriously injuring the other. Over the next three hours, as the park’s search and rescue team worked to extract the climbers, six more rockfalls originating from the new scar pummeled the base of the cliff. The following afternoon at 14:21 PST, a much larger rockfall occurred from the same location. A massive slab fell from just above the previous day’s rockfalls, fragmenting on impact and generating an enormous dust cloud (Fig. 1). A rock fragment struck a vehicle, puncturing the sunroof and injuring the driver, prompting temporary closure of the main road exiting Yosemite Valley. To manage these challenging events, the National Park Service (NPS) had a critical, immediate need for quantitative information regarding the sequence of events and the potential for additional rockfalls.
Manuscript received 17 April 2018. Revised manuscript received 10 May 2018. Manuscript accepted 11 May 2018. Posted 12 June 2018.
10.1130/GSATG374GW.1
©2018, The Geological Society of America. CC-BY-NC.
Figure 1
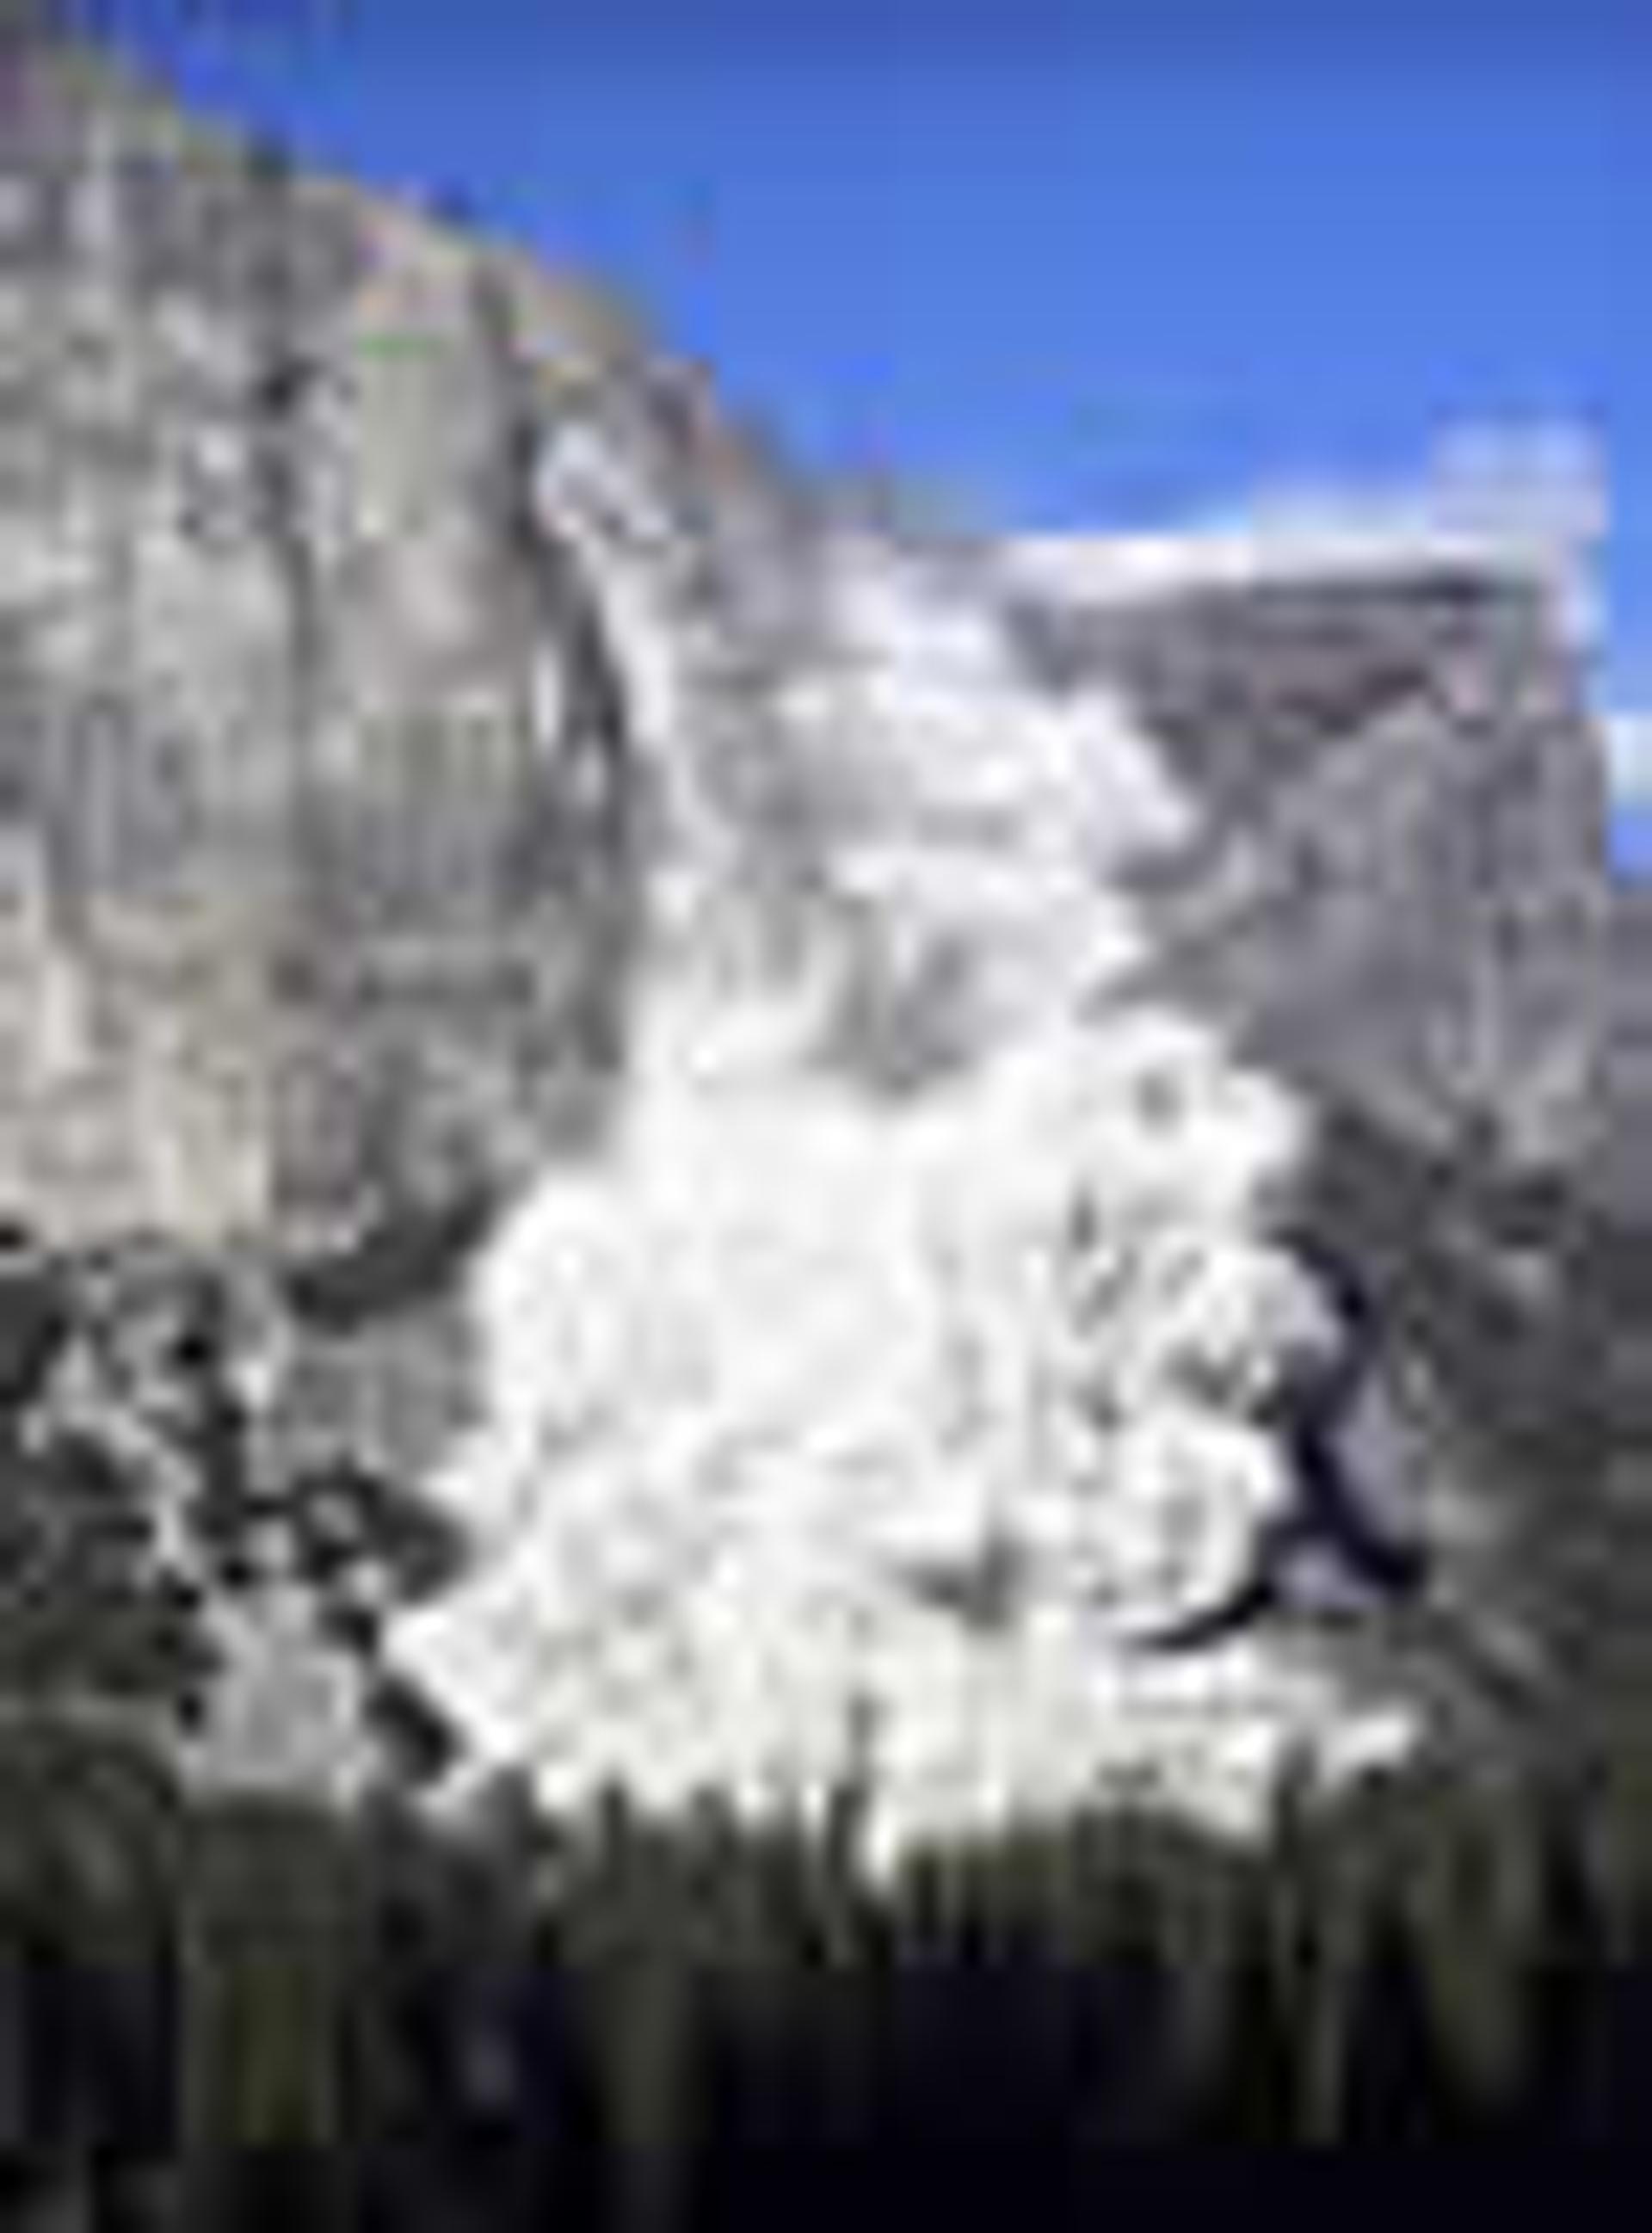
A 9,811 m3 rockfall from the southeast face of El Capitan at 14:21 PST on 28 Sept. 2017. Photo by Przemek Pawilkowski.
Baseline Data Collection
Rockfalls are common in Yosemite Valley, with up to 80 events documented each year (Stock et al., 2013). Rockfalls are the dominant erosional process in Yosemite, key to shaping this iconic landscape but also, with 4–5 million visitors to the park each year, posing significant risk (Stock and Collins, 2014). With more than 50 km2 of rockfall-prone cliffs in Yosemite Valley alone, it is difficult to anticipate when and where the next rockfall will occur. Accordingly, we have spent the past decade collecting baseline remote sensing data of the cliffs, including gigapixel imagery, infrared thermal imagery, and high-resolution terrestrial laser scanning (TLS) data. These data allow us to track rockfall activity, quantitatively document events, and evaluate rockfall susceptibility (e.g., Stock et al., 2017; Matasci et al., 2018). El Capitan has been a particular focus, with five TLS acquisitions since Oct. 2010. We also generated a “historical” 3D model using Structure-from-Motion (SfM) photogrammetry techniques (Westoby et al., 2012; Guerin et al., 2017); derived from black-and-white photographs taken from a helicopter ca. 1976, this SfM model shows El Capitan as it looked more than 40 years ago (Stock et al., 2017). All of these baseline data proved critical for rapidly analyzing the rockfalls that occurred in Sept. 2017.
Rapid Analysis of the El Capitan Rockfalls
Within three hours of the initial rockfall on 27 Sept., we acquired photographs of the cliff from a helicopter. We built a SfM point-cloud model from these photographs, aligned it with earlier TLS data, and performed a point-to-mesh comparison (e.g., Guerin et al., 2017). The resulting difference map yields precise locations, dimensions, and volumes for the rockfalls (Fig. 2). The cumulative volume of all rockfalls on 27 Sept. was 453.3 ± 42.3 m3, with the first event being the largest at 290.0 ± 27.8 m3. We repeated this process the following day after the larger 28 Sept. rockfall, comparing the new SfM model against data collected the previous day (Fig. 2). The 28 Sept. rockfall was 120 m tall, 45 m wide, and up to 8 m thick, with a total volume of 9,811.0 ± 408.2 m3. The impact of the collapsed slab on the cliff below dislodged another 430.2 ± 68.0 m3. Thus, the 28 Sept. rockfall was 23 times larger than the rockfalls that occurred the previous day. Within 24 hours, the NPS was able to disseminate this information to the public via press releases and social media.
Figure 2
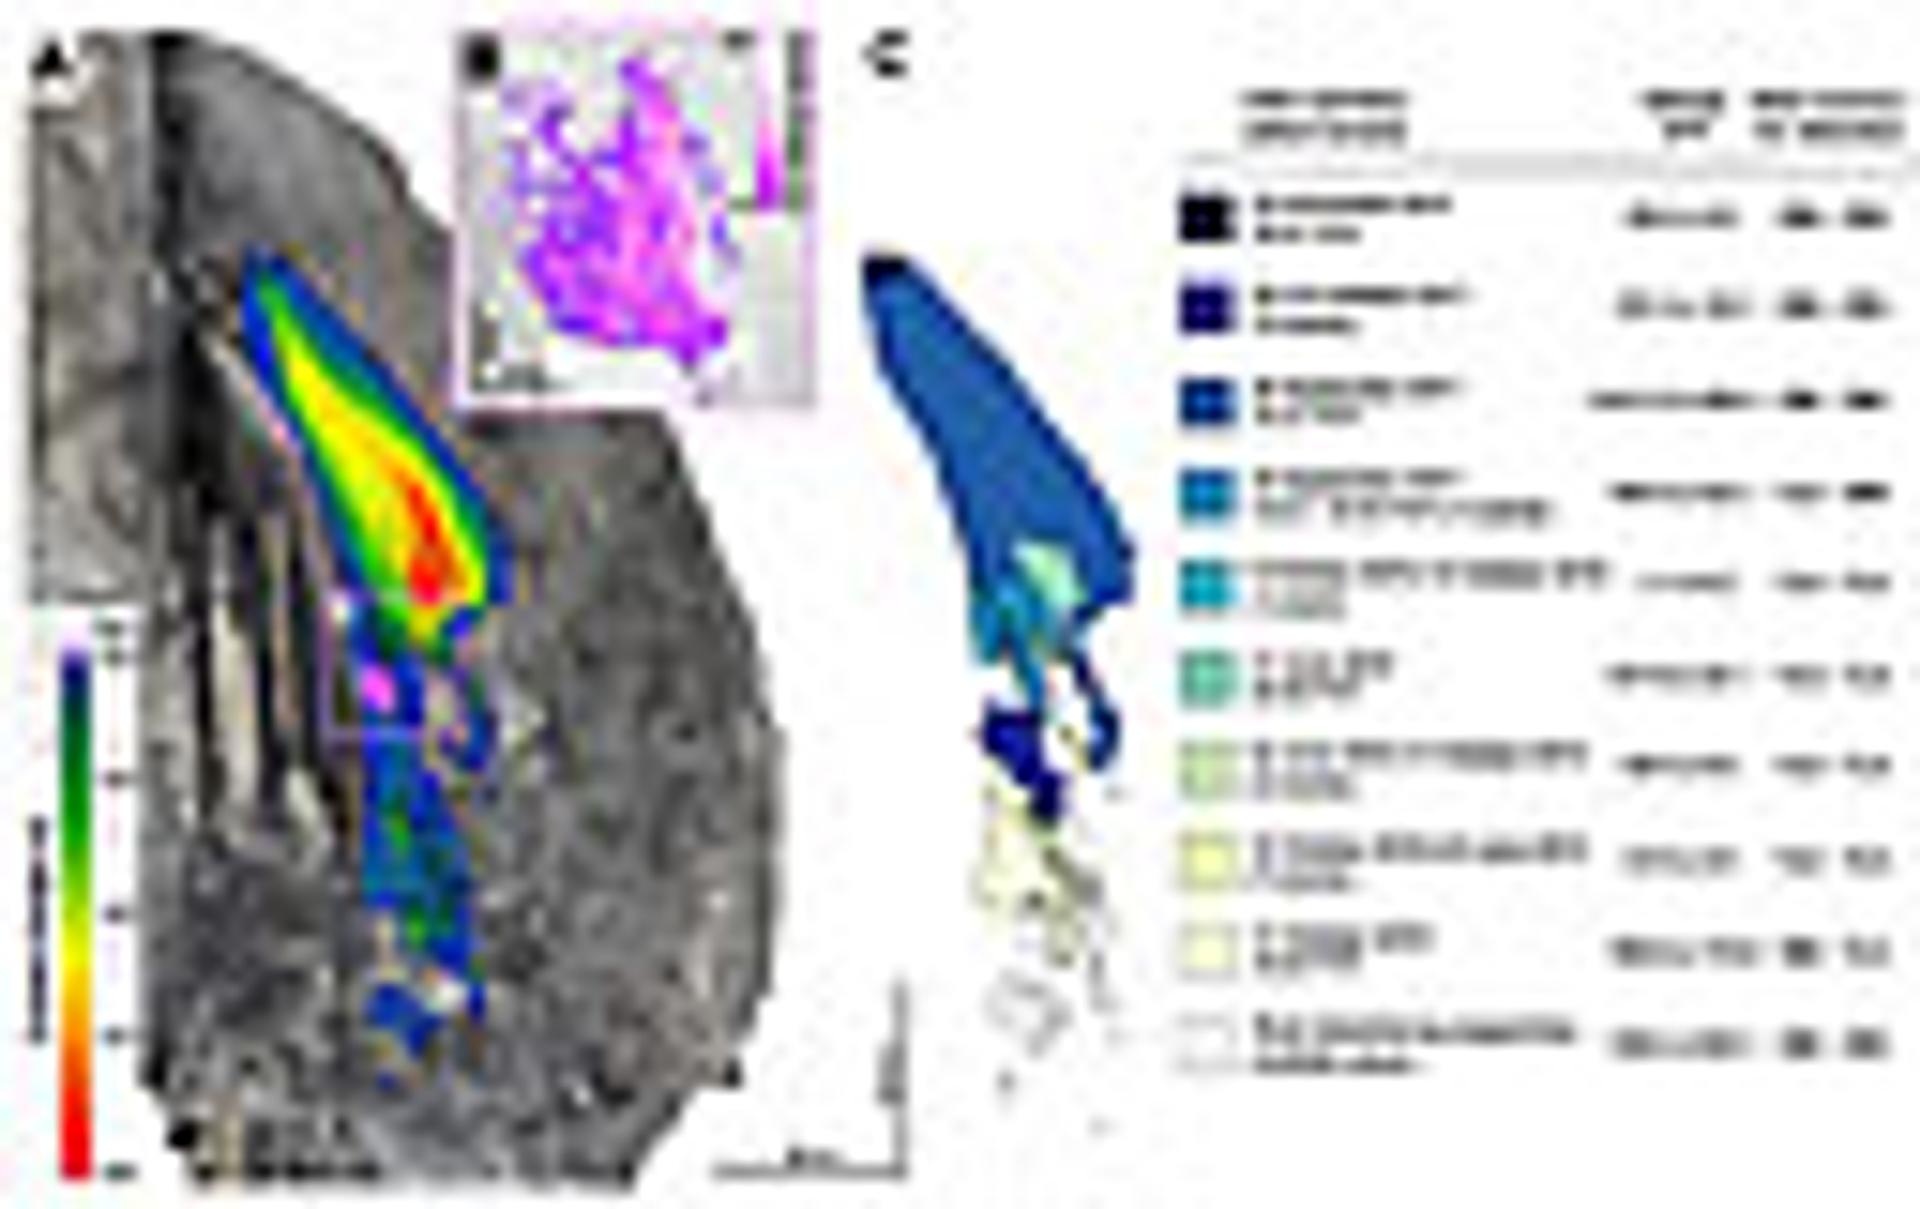
Spatial and temporal progression of rockfalls from the southeast face of El Capitan between Oct. 2010 and Nov. 2017. (A) Structure-from-Motion (SfM) model with color overlay showing the spatial progression of rockfalls, derived by comparing SfM models against earlier terrestrial laser scanning data (TLS). Negative surface change represents rockfall thicknesses; positive surface change, shown in (B), represents outward displacement of a rock sheet by up to 20 cm. (C) Temporal progression of rockfalls occurring between Oct. 2010 and Nov. 2017.
Importantly, the data also informed NPS decisions regarding public safety. Structural assessments of discontinuities and plausible future rockfall volumes, enabled by the 3D data, indicated low potential for an imminent rockfall that could reach the road, allowing the road to be reopened. Comparing the volumetric data with historical events (Stock et al., 2013) puts these rockfalls in perspective: the 28 Sept. rockfall was the 29th largest rockfall occurring in Yosemite since 1857, and has a return period of ~6 years.
After the immediate crisis had passed, subsequent analyses offered further insights into the longer-term evolution of the cliff. This area of El Capitan became active in Oct. 2010 (the first activity since at least 1976), with rockfalls occurring sporadically over the next several years, culminating in the large rockfalls on 27–28 Sept. 2017 (Fig. 2C). Subsequently, several smaller rocks fell in Oct. and Nov. 2017. Typical of progressive exfoliation-type failures (Stock et al., 2012), the rockfalls generally propagated upward from the location of the first event. The rockfalls mostly consisted of rock sheets tens of meters tall and wide but usually <1 m thick (Fig. 2A); more widely spaced regional joints influenced detachment of the larger-volume rockfalls. Finally, whereas differencing of SfM and TLS models typically yields negative surface change indicative of material loss, models generated after the Oct. 2017 rockfalls revealed an area of positive surface change. Here, a rock sheet 23 m tall, 14 m wide, and tens of cm thick rotated outward up to 20 cm along a vertical hinge line on its western side (Fig. 2B). The sheet is bounded on three sides by rockfall scars, and likely displaced during or immediately after the 22 Oct. 2017 rockfall. This geometry, combined with a simplified fracture mechanics analysis, indicates that the sheet should detach with another 20% of fracturing along the partially attached side. Although the 3-D data do not allow us to predict exactly when this will occur, they do define the precise location and volume of this future rockfall.
Our analysis of the El Capitan rockfalls demonstrates the utility of SfM for quickly generating 3-D cliff models that quantify rockfalls, and reinforces the value of having baseline data in place prior to a critical event. The ability to rapidly collect, analyze, and disseminate rockfall data in near-real time represents a significant stride forward in informing land managers and the public about this potent natural process.
References
- Guerin, A., Abellan, A., Matasci, B., Jaboyedoff, M., Derron, M.-H., and Ravanel, L., 2017, Brief communication: 3-D reconstruction of a collapsed rock pillar from Web-retrieved images and terrestrial lidar data—The 2005 event of the west face of the Drus (Mont Blanc massif): Natural Hazards and Earth System Sciences, v. 17, p. 1207–1220, https://doi.org/10.5194/nhess-17-1207-2017.
- Matasci, B., Stock, G.M., Jaboyedoff, M., Carrea, D., Collins, B.D., Guerin, A., Matasci, G., and Ravanel, L., 2018, Assessing rockfall susceptibility in steep and overhanging slopes using three-dimensional analysis of failure mechanisms: Landslides, v. 15, p. 859–878, https://doi.org/10.1007/s10346-017-0911-y.
- Stock, G.M., and Collins, B.D., 2014, Reducing rockfall risk in Yosemite National Park: Eos, v. 95, 22 July 2014, https://eos.org/project-updates/reducing-rockfall-risk-yosemite-national-park (last accessed 17 May 2017).
- Stock, G.M., Martel, S.J., Collins, B.D., and Harp, E.L., 2012, Progressive failure of sheeted rock slopes: The 2009–2010 Rhombus Wall rock falls in Yosemite Valley, California, USA: Earth Surface Processes and Landforms, v. 37, p. 546–561, https://doi.org/10.1002/esp.3192.
- Stock, G.M., Collins, B.D., Santaniello, D.J., Zimmer, V.L., Wieczorek, G.F., and Snyder, J.B., 2013, Historical rock fall in Yosemite National Park, California (1857–2011): U.S. Geological Survey Data Series 746, 17 p. and data files, https://pubs.usgs.gov/ds/746/ (last accessed 17 May 2018).
- Stock, G.M., Guerin, A., Matasci, B., Jaboyedoff, M., Derron, M.-H., and Collins, B.D., 2017, Quantifying 40 years of rockfall activity in Yosemite Valley with Structure-from-Motion and terrestrial lidar analyses: Geological Society of America Abstracts with Programs, v. 49, no. 6, https://gsa.confex.com/gsa/2017AM/webprogram/Paper299103.html (last accessed 17 May 2018).
- Westoby, M.J., Brasington, J., Glasser, N.F., Hambery, M.J., and Reynolds, J.M., 2012, ‘Structure-from-Motion’ photogrammetry: A low-cost, effective tool for geoscience applications: Geomorphology, v. 179, p. 300–314, https://doi.org/10.1016/j.geomorph.2012.08.021.
