
Page 8 - i1052-5173-30-8
P. 8
E values are not necessarily equal to the The CI tool (Fig. 6) provides a rapid, pre- in the field, subject to poor precision, or
finite strain. As reviewed in Ramsay and cise, and accurate tool for estimating CI. In arduous and time-consuming to do later in
Huber (1983), determining finite strain practical use on suitable rock faces, CI is the lab. StraboTools lets the field geologist
means understanding all of the possible typically reproducible within 1 or 2 absolute examine rock fabrics in situ or back in the
deformation mechanisms (e.g., creep, grain- percent (e.g., 15 ± 2). The values determined lab with thin sections or cut slabs. Because
boundary sliding, etc.). StraboTools does by the CI tool match those determined by the app requires the user to capture an
not give this information, but E correlates point counting within the same range. image and work on that same picture, it can
with strain, and the EFE aligns well with be used to thoroughly document the data
fabric, even fabrics that are too subtle to see FIELD GEOLOGY IN 2020 AND collected and can be reproduced or tested
(Fig. 1). For an igneous rock, the EFE may BEYOND on the same source by other scientists. The
capture a subtle grain shape fabric or crys- Using StraboTools can significantly en- tools also record the location and orienta-
tal alignment not evident in the field. hance the practice of field geology by pro- tion of the image, so it becomes more prac-
There are several cautions about using viding objective ways to collect data types tical to reproduce the actual field observa-
EFEs. First, they are highly sensitive to that are impractical or impossible to collect tions at a later date.
shadows and cracks or fractures. In tests on
glacially polished outcrops, a low sun angle
can produce an elongate EFE whose axis is
perpendicular to the sun azimuth even when
visible shadows are not apparent. It is good
practice to work with evenly shadowed sur-
faces. Second, although one can snap pho-
tos of images from computer screens, many
artifacts, such as moiré patterns and the
rectangular nature of pixels, can affect the
results. High-resolution original images
should be used whenever possible.
COLOR INDEX
Color index (CI), the volume percent of
dark minerals visible in an outcrop of plutonic
rock, is commonly estimated in the field. In
granitic rocks, dark minerals such as biotite,
hornblende, clinopyroxene, Fe-Ti oxides, and
titanite are commonly easy to observe, but
estimating their percentage by eye, especially
when the percentage is small, is a notoriously
difficult endeavor even for experienced
observers. Comparison charts (Folk, 1951;
Compton, 1985) are helpful, but it is still dif-
ficult to estimate CI accurately or precisely by
eye, with visual psychology playing a promi-
nent role in introducing biases (Allen, 1956;
Dennison and Shea, 1966).
Accurate measurement of CI in the field
could allow the delineation of zoning pat-
terns that previously required laboratory or
thin-section analysis. For example, the Half
Dome and Cathedral Peak plutons in
Yosemite National Park form a gradationally
nested pair with a consistent inward decrease
in CI that accompanies significant parallel
changes in bulk composition (Bateman et al.,
1988). The Cathedral Peak Granodiorite
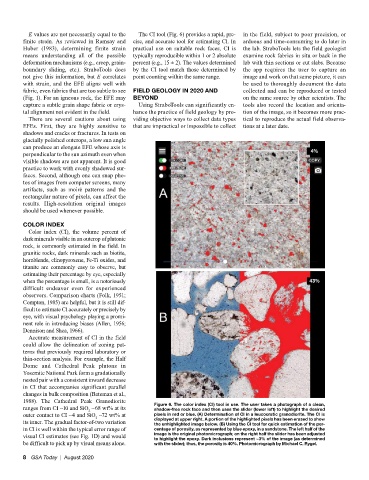
ranges from CI ~10 and SiO ~68 wt% at its Figure 6. The color index (CI) tool in use. The user takes a photograph of a clean,
shadow-free rock face and then uses the slider (lower left) to highlight the desired
2
outer contact to CI ~4 and SiO ~72 wt% at pixels in red or blue. (A) Determination of CI in a leucocratic granodiorite. The CI is
2
its inner. The gradual factor-of-two variation displayed at upper right. A portion of the highlighted pixels has been erased to show
the unhighlighted image below. (B) Using the CI tool for quick estimation of the per-
in CI is well within the typical error range of centage of porosity, as represented by blue epoxy, in a sandstone. The left half of the
visual CI estimates (see Fig. 1D) and would image is the original photomicrograph; on the right half the slider has been adjusted
to highlight the epoxy. Dark inclusions represent ~3% of the image (as determined
be difficult to pick up by visual means alone. with the slider); thus, the porosity is 40%. Photomicrograph by Michael C. Rygel.
8 GSA Today | August 2020