
Page 5 - i1052-5173-30-8
P. 5
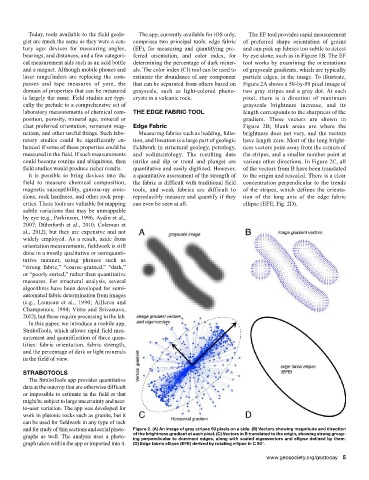
Today, tools available to the field geolo-  The app, currently available for iOS only,   The EF tool provides rapid measurement
         gist are much the same as they were a cen-  comprises two principal tools: edge fabric   of preferred shape orientation of grains
         tury ago: devices for measuring angles,   (EF), for measuring and quantifying pre-  and can pick up fabrics too subtle to detect
         bearings, and distances, and a few categori-  ferred orientation, and color index, for   by eye alone, such as in Figure 1B. The EF
         cal measurement aids such as an acid bottle   determining the percentage of dark miner-  tool works by examining the orientations
         and a magnet. Although mobile phones and   als. The color index (CI) tool can be used to   of grayscale gradients, which are typically
         laser rangefinders are  replacing the com-  estimate the abundance of any component   particle edges, in the image. To illustrate,
         passes and tape measures of yore, the   that can be separated from others based on   Figure 2A shows a 50-by-50 pixel image of
         domain of properties that can be measured   grayscale, such as light-colored pheno-  two  gray  stripes  and  a  gray  dot.  At  each
         is largely the same. Field studies are typi-  crysts in a volcanic rock.  pixel, there is a direction of maximum
         cally the prelude to a comprehensive set of                            grayscale brightness increase, and its
         laboratory measurements of chemical com-  THE EDGE FABRIC TOOL         length corresponds to the sharpness of the
         position, porosity, mineral age, mineral or                            gradient. These vectors are shown in
         clast preferred orientation, remanent mag-  Edge Fabric                Figure 2B; blank areas are where the
         netism, and other useful things. Such labo-  Measuring fabrics such as bedding, folia-  brightness does not vary, and the vectors
         ratory studies  could be significantly en-  tion, and lineation is a large part of geologic   have length zero. Most of the long bright-
         hanced if some of these properties could be   fieldwork in structural geology, petrology,   ness vectors point away from the centers of
         measured in the field. If such measurements   and sedimentology. The resulting data   the stripes, and a smaller number point at
         could become routine and ubiquitous, then   (strike and dip or trend and plunge) are   various other directions. In Figure 2C, all
         field studies would produce richer results.  quantitative and easily digitized. However,   of the vectors from B have been translated
          It is possible to bring devices into the   a quantitative assessment of the strength of   to the origin and rescaled. There is a clear
         field to measure chemical composition,   the fabric is difficult with traditional field   concentration perpendicular to the trends
         magnetic susceptibility, gamma-ray emis-  tools, and weak fabrics are difficult to   of the stripes, which defines the orienta-
         sions, rock hardness, and other rock prop-  reproducibly measure and quantify if they   tion of the long axis of the edge fabric
         erties. These tools are valuable for mapping   can even be seen at all.  ellipse (EFE; Fig. 2D).
         subtle variations that may be unmappable
         by eye (e.g., Parkinson, 1996; Aydin et al.,
         2007; Dühnforth et al., 2010; Coleman et
         al., 2012), but they are expensive and not
         widely employed. As a result, aside from
         orientation measurements, fieldwork is still
         done in a mostly qualitative or semiquanti-
         tative manner, using phrases such as
         “strong fabric,” “coarse-grained,” “dark,”
         or “poorly sorted,” rather than quantitative
         measures.  For  structural  analysis,  several
         algorithms have been developed for semi-
         automated fabric determination from images
         (e.g., Launeau et al., 1990; Ailleres and
         Champenois, 1994; Vinta and Srivastava,
         2012), but these require processing in the lab.
          In this paper, we introduce a mobile app,
         StraboTools, which allows rapid field mea-
         surement and quantification of three quan-
         tities: fabric orientation, fabric strength,
         and the percentage of dark or light minerals
         in the field of view.

         STRABOTOOLS
          The StraboTools app provides quantitative
         data at the outcrop that are otherwise difficult
         or impossible to estimate in the field or that
         might be subject to large uncertainty and user-
         to-user variation. The app was developed for
         work in plutonic rocks such as granite, but it
         can be used for fieldwork in any type of rock
         and for study of thin sections and aerial photo-  Figure 2. (A) An image of gray stripes 50 pixels on a side. (B) Vectors showing magnitude and direction
         graphs as well. The analysis uses a photo-  of the brightness gradient at each pixel. (C) Vectors in B translated to the origin, showing strong group-
                                             ing perpendicular to dominant edges, along with scaled eigenvectors and ellipse defined by them.
         graph taken within the app or imported into it.  (D) Edge fabric ellipse (EFE) derived by rotating ellipse in C 90°.
                                                                                        www.geosociety.org/gsatoday  5