
Page 7 - i1052-5173-30-8
P. 7
explains them. Both techniques are labor- in each case, the EFE determined from The EFE (red) is almost coincident with the
intensive and subjective, even with image StraboTools provides a close estimate of the imposed strain ellipse (blue), yielding an
analysis and automation. imposed strain. Figure 5C shows randomly EFE aspect ratio E of 1.18 and an azimuth of
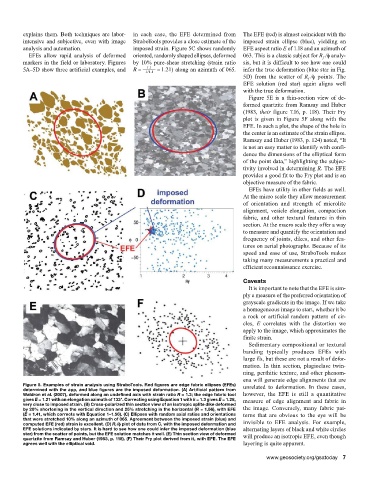
EFEs allow rapid analysis of deformed oriented, randomly shaped ellipses, deformed 063. This is a classic subject for R /f analy-
f
markers in the field or laboratory. Figures by 10% pure-shear stretching (strain ratio sis, but it is difficult to see how one could
5A–5D show three artificial examples, and R = 1/1.1 = 1.21) along an azimuth of 065. infer the true deformation (blue star in Fig.
1.1
5D) from the scatter of R /f points. The
f
EFE solution (red star) again aligns well
with the true deformation.
Figure 5E is a thin-section view of de-
formed quartzite from Ramsay and Huber
(1983, their figure 7.16, p. 118). Their Fry
plot is given in Figure 5F along with the
EFE. In such a plot, the shape of the hole in
the center is an estimate of the strain ellipse.
Ramsay and Huber (1983, p. 124) noted, “It
is not an easy matter to identify with confi-
dence the dimensions of the elliptical form
of the point data,” highlighting the subjec-
tivity involved in determining R. The EFE
provides a good fit to the Fry plot and is an
objective measure of the fabric.
EFEs have utility in other fields as well.
At the micro scale they allow measurement
of orientation and strength of microlite
alignment, vesicle elongation, compaction
fabric, and other textural features in thin
section. At the macro scale they offer a way
to measure and quantify the orientation and
frequency of joints, dikes, and other fea-
tures on aerial photographs. Because of its
speed and ease of use, StraboTools makes
taking many measurements a practical and
efficient reconnaissance exercise.
Caveats
It is important to note that the EFE is sim-
ply a measure of the preferred orientation of
grayscale gradients in the image. If we take
a homogeneous image to start, whether it be
a rock or artificial random pattern of cir-
cles, E correlates with the distortion we
apply to the image, which approximates the
finite strain.
Sedimentary compositional or textural
banding typically produces EFEs with
large Es, but these are not a result of defor-
mation. In thin section, plagioclase twin-
ning, perthitic texture, and other phenom-
ena will generate edge alignments that are
Figure 5. Examples of strain analysis using StraboTools. Red figures are edge fabric ellipses (EFEs) unrelated to deformation. In these cases,
determined with the app, and blue figures are the imposed deformation. (A) Artificial pattern from
Waldron et al. (2007), deformed along an undefined axis with strain ratio R = 1.3; the edge fabric tool however, the EFE is still a quantitative
gives E = 1.21 with an elongation azimuth of 133°. Correcting using Equation 1 with k = 1.3 gives E = 1.28, measure of edge alignment and fabric in
very close to imposed strain. (B) Cross-polarized thin section view of an isotropic aplite dike deformed
by 20% shortening in the vertical direction and 25% stretching in the horizontal (R = 1.56), with EFE the image. Conversely, many fabric pat-
(E = 1.41, which corrects with Equation 1–1.56). (C) Ellipses with random axial ratios and orientations terns that are obvious to the eye will be
that were stretched 10% along an azimuth of 065. Agreement between the imposed strain (blue) and invisible to EFE analysis. For example,
computed EFE (red) strain is excellent. (D) R f /f plot of data from C, with the imposed deformation and
f
EFE solutions indicated by stars. It is hard to see how one could infer the imposed deformation (blue alternating layers of black and white circles
star) from the scatter of points, but the EFE solution matches it well. (E) Thin section view of deformed will produce an isotropic EFE, even though
quartzite from Ramsay and Huber (1983, p. 118). (F) Their Fry plot derived from it, with EFE. The EFE
agrees well with the elliptical void. layering is quite apparent.
www.geosociety.org/gsatoday 7