
Page 6 - i1052-5173-30-8
P. 6
Axis lengths and orientations are com- The EF tool gives a quantitative measure Huber (1983) Sessions 5–8 (pages 73–149).
puted using the eigenvectors and eigenval- of fabric strength. In Figure 4, a shear zone They describe methods and give exercises
ues of the variance-covariance matrix comprises various high-strain zones cutting appropriate to the sorts of rocks discussed
(Appendix 2). Because the vectors are ori- weakly foliated granodiorite. By making here, with the analyses commonly per-
ented perpendicular to edges, and we want EFEs in subareas, a gradation in strength formed using the Fry (1979) center-to-
the dominant edge direction, we simply and orientation of fabric is clear. This can center technique or the R f /f technique of
rotate the ellipse 90° to produce the EFE be done rapidly on the outcrop. Dunnet (1969). The former involves finding
(Fig. 2D). The aspect ratio of the EFE, des- anticlustered markers and graphing their
ignated E, is a measure of the strength of the Making Fabric Measurement center-to-center distances; the latter mea-
fabric defined by edge alignment. Portable and Fast suring the aspect ratios and elongation
The EFE determined from grayscale gra- Perhaps the most commonly used text on directions of elliptical markers, and then
dients should be equivalent to the strain quantitative strain analysis is Ramsay and finding a finite-strain ellipse that best
ellipse in the case of deformation of a homo-
geneous material with passive markers.
However, empirical tests show that for
images deformed digitally by pure shear,
E = R , (1)
k
where R is the standard strain ratio (ratio of
long and short axes of the strain ellipse), and
the exponent k typically lies in the range 1.2–
1.5 for images of natural samples (e.g., gran-
ite or sandstone). Because k > 1, the aspect
ratio of the EFE, E, is less than that of the
strain ellipse, R. This is likely a consequence
of image pixelization, and a full treatment of
this is beyond the scope of this paper.
Measuring Edge Fabric
To determine EF, the user takes a photo-
graph of a suitable rock face with the mobile
device held parallel to the face. The app
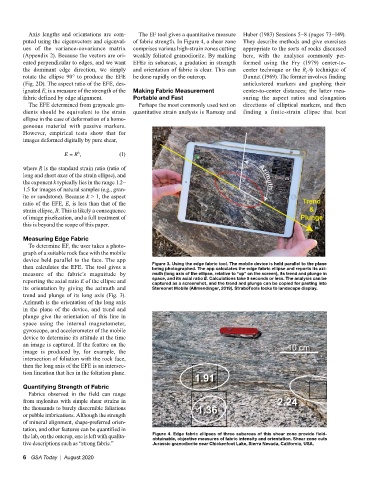
then calculates the EFE. The tool gives a Figure 3. Using the edge fabric tool. The mobile device is held parallel to the plane
being photographed. The app calculates the edge fabric ellipse and reports its azi-
measure of the fabric’s magnitude by muth (long axis of the ellipse, relative to “up” on the screen), its trend and plunge in
reporting the axial ratio E of the ellipse and space, and its axial ratio E. Calculations take 5 seconds or less. The analysis can be
captured as a screenshot, and the trend and plunge can be copied for pasting into
its orientation by giving the azimuth and Stereonet Mobile (Allmendinger, 2019). StraboTools locks to landscape display.
trend and plunge of its long axis (Fig. 3).
Azimuth is the orientation of the long axis
in the plane of the device, and trend and
plunge give the orientation of this line in
space using the internal magnetometer,
gyroscope, and accelerometer of the mobile
device to determine its attitude at the time
an image is captured. If the feature on the
image is produced by, for example, the
intersection of foliation with the rock face,
then the long axis of the EFE is an intersec-
tion lineation that lies in the foliation plane.
Quantifying Strength of Fabric
Fabrics observed in the field can range
from mylonites with simple shear strains in
the thousands to barely discernible foliations
or pebble imbrications. Although the strength
of mineral alignment, shape-preferred orien-
tation, and other features can be quantified in
the lab, on the outcrop, one is left with qualita- Figure 4. Edge fabric ellipses of three subareas of this shear zone provide field-
obtainable, objective measures of fabric intensity and orientation. Shear zone cuts
tive descriptions such as “strong fabric.” Jurassic granodiorite near Chickenfoot Lake, Sierra Nevada, California, USA.
6 GSA Today | August 2020