
The development and evolution of the William Smith 1815 geological map from a digital perspective
Peter Wigley
In this article
Full Text View
GSA Today
Article, pp. 4-10 | Abstract | PDF (6.4MB)
The development and evolution of the William Smith 1815 geological map from a digital perspective
[Table: Table of Contents Nineteenth-Century Map Technology Smith’s Representation of Geology on the Ma...]
Peter Wigley
Lynx Geographic Information Systems Ltd, 93-99 Upper Richmond Road, Putney, London SW15 2TG, UK
Abstract
William Smith’s 1815 geological map of England and Wales is a masterpiece; the map differs from all other contemporaneous maps in that Smith applied the principles of stratigraphy to its construction. The maps are extremely rare and therefore not readily available for study and analysis; however, over the past decade a number of Smith geological maps have been digitally scanned and some incorporated into a Geographic Information System (GIS). Early nineteenth-century maps of the United Kingdom (UK) present a number of difficulties when trying to build them into a GIS, mostly related to projection problems and the fact that many pre-date the “1st Principal Triangulation” of the UK. However, once in the GIS, they can be used with great effect to show the evolution of Smith’s maps and also to compare his maps with modern geology. When combined with digital terrain data, Smith’s maps can be displayed in 3D.
Manuscript received 18 Dec. 2015; accepted 20 Feb. 2016
doi: 10.1130/GSATG279A.1
Nineteenth-Century Map Technology
William Smith (1769–1839) was an undoubted geological genius with an amazing eye for the countryside and an ability to think in three dimensions. He was also an expert surveyor, apprenticed in his youth to Edward Webb (1751–1828) at Stow-on-the-Wold, where he learned to measure and value land during the time of the Enclosure Acts (Torrens, 2001). This skill may have classified him as an artisan in the eyes of the gentlemen of the Geological Society of London and thus precluded his membership of the Society; however, it was to prove essential in the production of the great map. Through use of sextant, plane table, and other surveying instruments (the high-tech of the time), Smith was able to locate outcrops on his field maps. Today with GPS, laser rangefinders, and access to remote-sensing data, the whole process of map making is very much easier than it was in Smith’s day—yet, for all that, some eighteenth- and nineteenth-century maps of England are remarkably accurate.
It is highly unlikely that Smith’s map would ever have been made were it not for the help of John Cary (1755–1835). Cary was a mapmaker, engraver, and publisher; he probably first met Smith when he engraved his plan of the Somerset Canal in 1793 (Torrens, 2007, p. 13). At that time, Cary’s maps were some of the best available. In 1794, he was commissioned by the Post Office to map towns and roads on his New Map of England and Wales. At that time, postal charges were based on distance, and it was therefore important to the Post Office that Cary show “the actual distance from one Market Town to another with the exact admeasurement prefixed to each from the Metropolis [London]” (Cary, 1796). Cary was aided in this task by material provided by the Post Master General, but he also undertook a number of local, detailed triangulated surveys in order to complete the map. The map was produced at a scale of approximately one inch to five miles (1:316,000) and Cary was to use this map as the basis for the 1815 Smith map.
Figure 1 illustrates how the base map was compiled; the three maps are from part of the county of Wiltshire. The top map (A) is from Cary’s 1794 New Map of England and Wales and shows in extraordinary detail roads, canals, rivers, towns, and villages included by Cary. The middle (B) map is a de-colored Smith 1815 map and shows how Cary and Smith simplified the road network, reduced the number of towns and villages located (and reduced the size and style of the typeface), while at the same time emphasizing topographic features. Incidentally, Cary, ever mindful of commercial implications, ensured that the outlines of the estates of wealthy landowners were always included. This map also shows Smith’s engraved geological lines. Map (C) is the corresponding part of the 1815 map, which was hand-colored to show the geology.
Figure 1
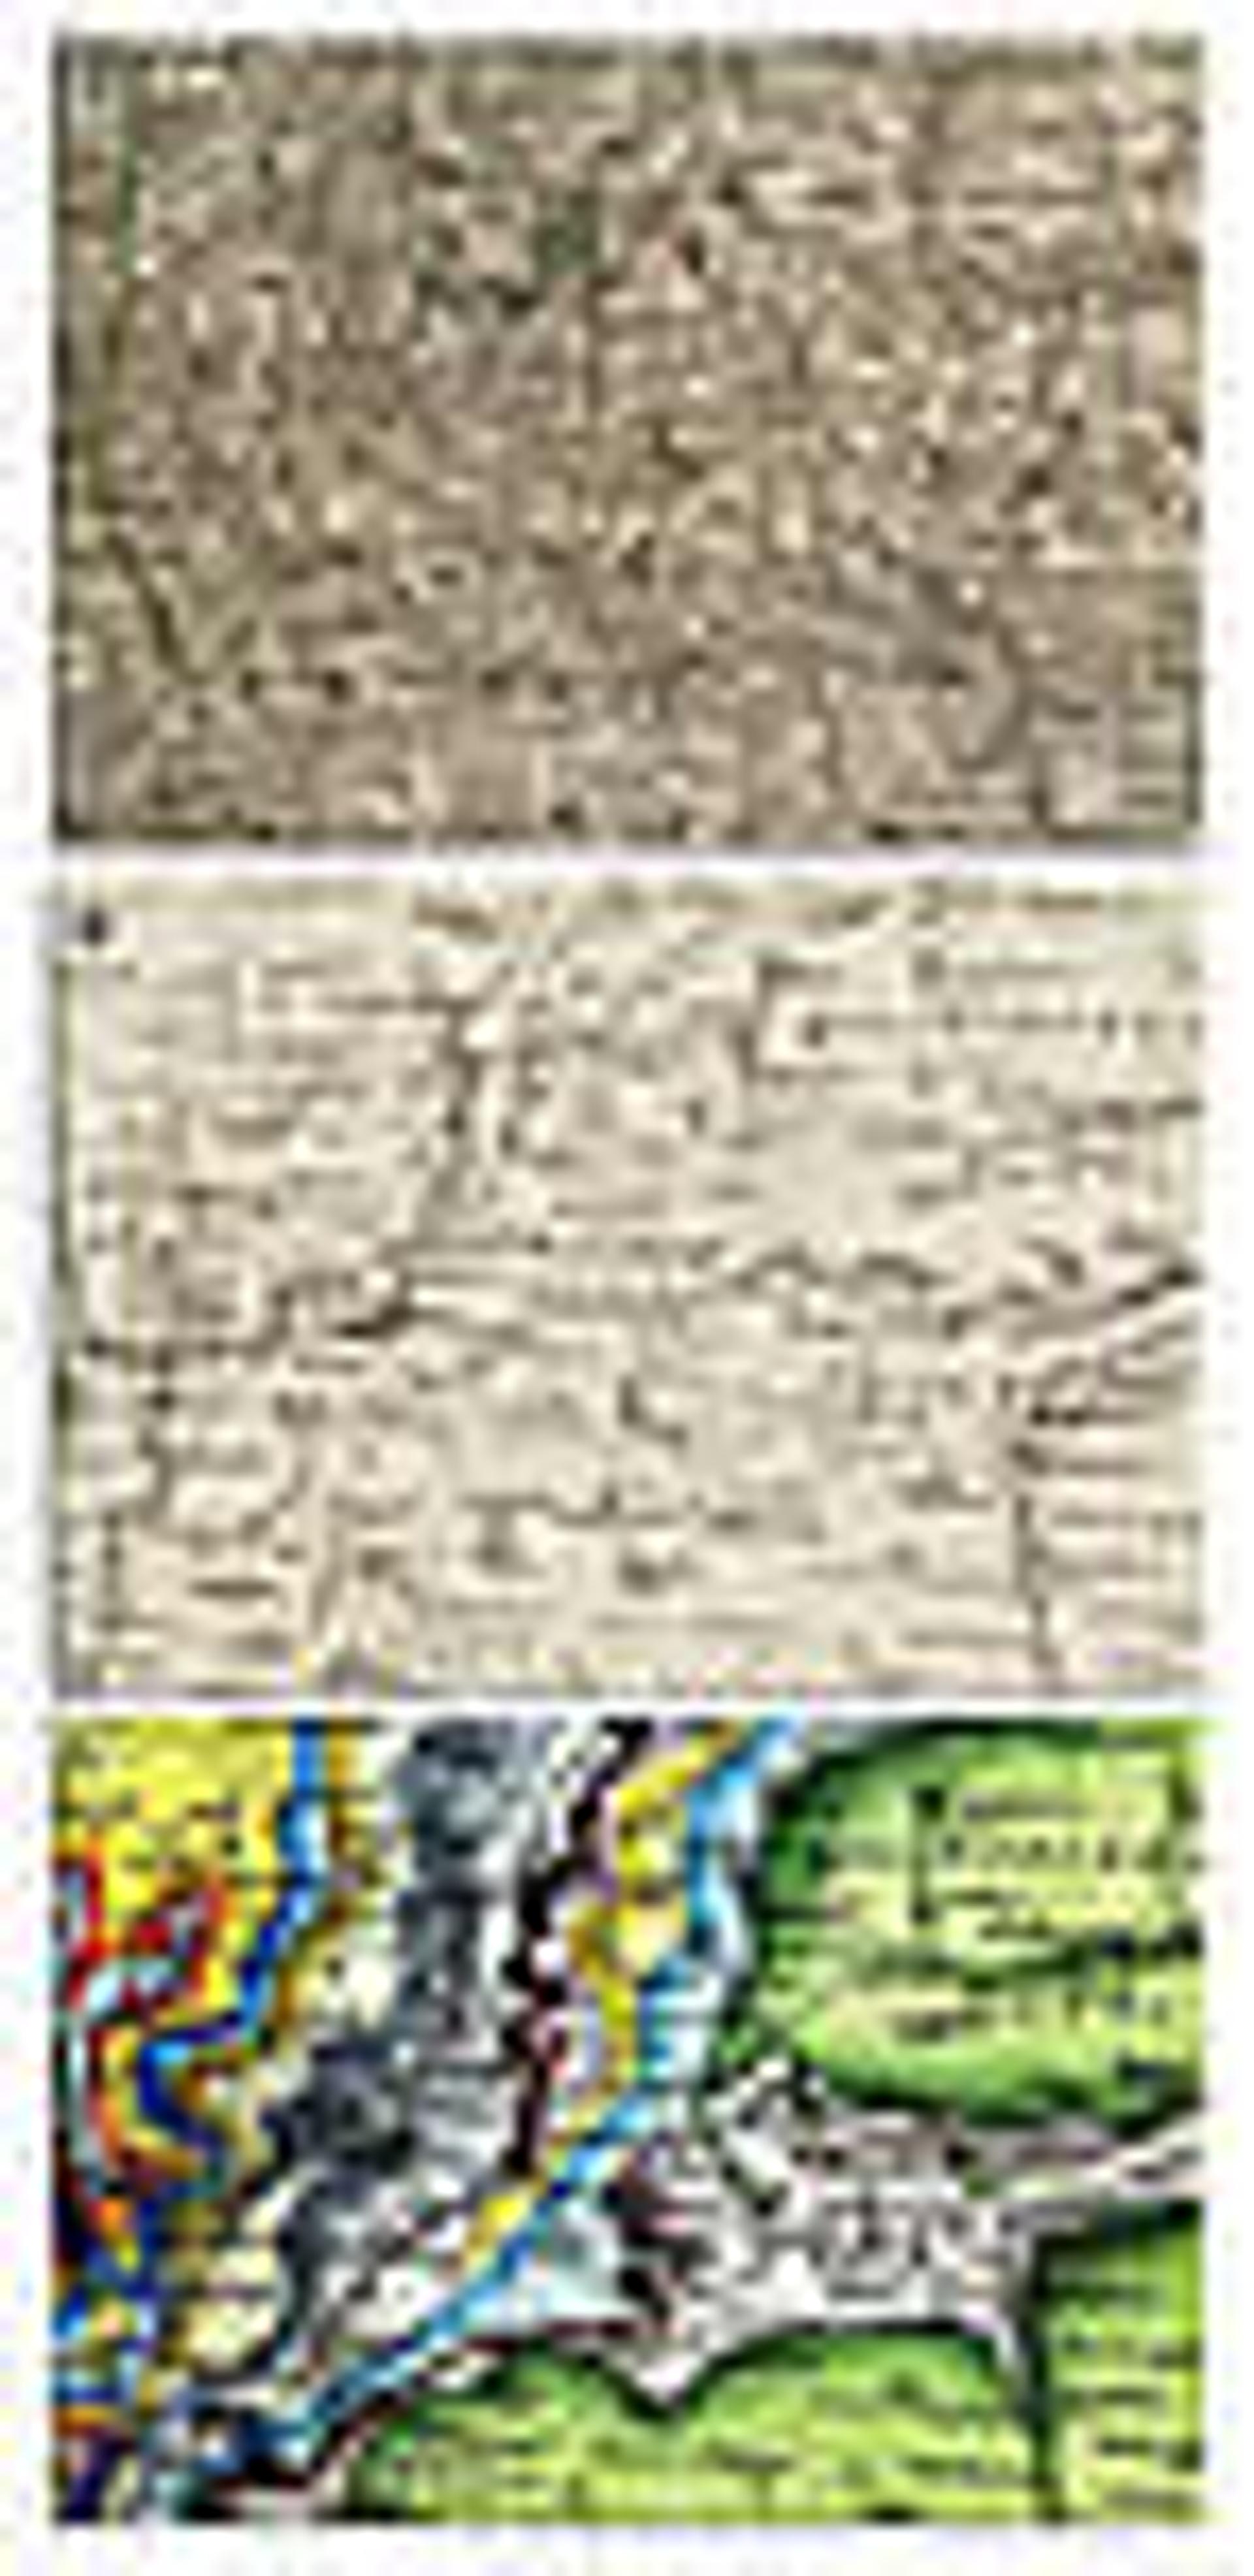
Stages in the compilation of William Smith’s 1815 Geology map by John Cary (showing part of Wiltshire).
Smith’s geological mapping was not limited to the great 1815 map. Between 1819 and 1824, John Cary published, in six parts, Smith’s geological maps of 21 English counties. The New Geological Atlas of England and Wales was used for its base maps. The large county sheets of Cary’s New English Atlas have been described as “remarkable for their accuracy and their clear, clean print brilliantly engraved, and rank with the Ordnance Survey as the finest maps of the nineteenth century” (Tooley, 1952). Smith could not have had a finer set of topographic maps upon which to draw his geological lines.
Smith’s Representation of Geology on the Map
Smith’s initial problem was how best to show the distribution of his strata on maps. Should it be by point locations, lines, or colors? As we know, Smith chose a combination of both line and color. His colors generally had some lithological significance and indeed are still used today. Smith also used graded tints on his maps, with the strongest color at the base of the bed at outcrop, lightening upward. This is what Smith says in his memoir to the map:
The Society of Arts very wisely foresaw, in offering their premium for a mineralogical map (which I have just had the honour to obtain), that one of the greatest difficulties in understanding such an extensive branch of natural history arose from the want of some method of generalizing the information, which could only be supplied by a map that gives, in one view, the locality of thousands of specimens. By strong lines of colour, the principal ranges of strata are rendered conspicuous, and naturally formed into classes, which may be seen and understood at a distance from the map, without distressing the eye to search for small characters. This is the advantage of colours over any other mode of representation. (Smith, 1815, p. 11)
The effect of Smith’s striking coloring technique also serves to give added depth to the two-dimensional plane of the map: the individual strata appear to have a measure of three-dimensional relief, which makes their relationship to one another more apparent.
Mapping Scale
The 1815 map measures more than eight feet by six feet and was printed on 15 sheets. This map was the canvas upon which Smith documented his observations; he would not have used it in the field because the scale was too small. Smith did make an early experiment using a Cary one-inch to twenty-mile (~1:1,300,000) map, but he said that the “maps were spoiled by speculating on the ranges of stratification without sufficient data” (Smith, 1815, p. 27). His memoirs also record that he colored a map in the vicinity of Bath and also used the Day and Masters County Survey of Somerset (1782) (Phillips, 1844, p. 27).
In the early nineteenth century, scale adjustment was more difficult but not insurmountable. In order to scale his field maps onto the 1815 base map, Smith would almost certainly have used a pantograph. Smith was very familiar with this instrument. In his journal entry for Friday, 18 December 1789, Smith records time spent “Repairing and Setting the pentograph [pantograph]” before he “began to reduce the Plan of a Mr. C. Norton’s allotments” (OUMNH Archive, Diaries, WS/B0 p. 55). It is important to realize that although Smith’s final map may have been small scale, its content was derived from his large-scale field maps.
Projections
Smith would not have been overly concerned about the projection of his base map; however, projections are a crucial element of any Geographic Information System (GIS). Projection information does not appear on any Cary or Smith map. The graticules around the margins of the maps show ticks of longitude and latitude (usually based on the Greenwich meridian), but in most cases there are no internal coordinate lines/ticks within the body of the map. On the Cary Turnpike map, the latitude degree ticks are angled to the frame, indicating that parallels may be curved lines. Meridians may or may not be straight, but in all cases are not parallel. However, although only a small-scale map, the General Index Map for Cary’s 1794 New Map of England and Wales and Part of Scotland does have internal longitude and latitude lines. Some information is available regarding commonly used late eighteenth-century and early nineteenth-century projections. John Snyder gives a good account of these projections (Snyder, 1993); his list of projections was tested on the Smith and Cary maps used in the GIS. First-order polynomial transformation (affine) was used to project map images to coordinates for each of the tested projections. Residual (RMS) errors were calculated based on the framing graticules. Typical errors ranged from >4,500 m (14,764 ft) to <1000 m (3281 ft). Some projections (e.g., Lambert Azimuthal Equal Area) achieved a good fit on the graticule but had a considerably distorted shape. Apart from the residual errors on the graticules, a judgment also had to be made on the fit to places and coastlines. In this regard, it is worth remembering that the maps are all about 200 years old. Essentially, they predate the 1st Principal Triangulation of the country, which started in 1783 and was not completed until 1853 (although the first phase was complete by 1796). Although the general shape of England and Wales is excellent on all maps, it does differ from the modern coastline. For example, the Cary and Smith maps show the position of Lands End to be >4 miles north of its actual position; similarly, the Isle of Man is offset by ~8 miles to the northeast. Bonne, Cassini, and Transverse Mercator projections all achieved relatively good results. Bonne was marginally the best fit on the Smith 1815 map, closely followed by Cassini (used by the Ordnance Survey for the Old Series 1 maps of England and Wales), which gave the best fit on the Smith County maps. One additional piece of indirect evidence is that projection tests on the small-scale General Index to Cary’s 1794 New Map of England and Wales, which does contain internal coordinate lines, give RMS errors of 1448 m (4750 ft) for Cassini against 1637 m (5370 ft) for Bonne. The difference in error is too small for any definitive statement to be made as to which projection was used, but on balance it is more likely that a Cassini projection (on a sphere) was used for both the Smith 1815 and County maps.
Transformations
Having decided that Cassini was overall the best-fit projection, the maps were transformed to that projection. Graticules on the 1815 map provided some limited information, which was supplemented by John Cary’s locations of towns and villages. For the county maps, some 1,800 graticule longitude and latitude points were transformed using town and village locations and RMS errors obtained. In general, transformation errors were lower in southeast England and tended to increase to the north and west.
The 1st Principal Triangulation
The 1st Principal Triangulation of the UK and Ireland was conducted over six decades and was a remarkable achievement that significantly improved the accuracy of nineteenth-century maps of the country. The Principal Triangulation commenced in 1783 under the direction of General William Roy with the objective of connecting the observatories of Greenwich and Paris and determining the difference in longitude between them. After Roy’s death in 1790, the survey was extended across the UK and Ireland under the direction of Colonel Williams, General Mudge, General Colby, Colonel Hall, and finally Colonel Henry James. Apart from improving map accuracy, the triangulation allowed Alexander Clarke to compute a spheroid for Earth and make density calculations. The first stage in the triangulation was the measurement of an accurate baseline between Kings Arbour (now the site of the Heathrow Airport car park) and the Poor House at Hampton. This was first achieved by iron bars and deal rods and then remeasured using glass tubes. Corrections were made for temperature and humidity and the line accurately leveled; the final accuracy is estimated at an amazing one inch in 27,400 ft. After completion of the line, a number of triangulations were made in a southeasterly direction toward the Kent coast. The triangulations were made using a specially commissioned theodolite constructed by Jesse Ramsden. As the triangulation proceeded, it become obvious that there were large inaccuracies in existing maps of the country. In 1799, Mudge and Dalby made a number of severe criticisms of the “erroneous state of our maps.” Cary’s maps were not specifically mentioned by Mudge and Dalby and while at the local level Cary’s maps are accurate, errors become amplified in country-wide maps.
Evolution of Smith’s Geological Mapping
Smith’s 1815 map exists in at least six main variants in five series as recognized by Eyles and Eyles (1938), based on changes to the geology, coloring, and topographic detail. These include an early unnumbered issue (Series I); an early issue second series numbered 1–100 (Series II); another, mostly second issue third series, numbered a1 to a100 (Series III); a third issue, numbered b1–b75 or possibly to b100 (Series IV); and a late unnumbered series (Series V), which is divided into Va maps, similar to late Series IV and Vb, possibly part of a second 1830s series (Sharpe, 2007, and personal commun.). The early and late unnumbered maps are not signed by Smith, while the numbered issues are usually signed. The map is dated 1st August 1815; however, two early Series I unnumbered maps were issued before this date, with a further 20 in September–October 1815. However, most maps were not issued until after 2 November 1815, when Smith began signing and numbering his maps. Countermarks on the very late Z map (which hangs in The Geological Society of London’s Burlington House) date it as 1836 or later. Smith’s memoir lists 410 subscribers for 414 copies of his 1815 map. Not all subscribers took their copies, and some maps went to non-subscribers; the total production run was probably around 350, of which 120–130 may still survive (Tom Sharpe, 2014, personal commun.).
In order to demonstrate the evolution of Smith’s geological mapping, extracts from various maps around the city of Oxford have been produced from the GIS and are shown in Figure 2. All three Smith maps use the same basic scheme of colors and tinting technique, although there are some significant changes in geological content. All the maps show a succession of strata, oldest (Great Oolite) in the northwest and getting progressively younger to the southeast (Chalk). The Smith A map at the top of the panel is a very early unsigned copy and was probably the Geological Society subscription copy. Tinting on the A map tends to be light, almost tentative, often grading to no color. Smith himself says, “In many cases the edge of one stratum terminating on another is so gradual, as not to admit of any distinction or definite line” (Smith, 1815, p. 8). Where there is no color, the formation is assumed to be intermediate between the strata above and below. However, on early issue maps (like the A map) the Greensand is purposely shown colorless. Also, in early maps the Coral Rag is not shown as a separate formation, only sandstone between the Clunch Clay and the Oaktree Clay. The later issue P map (Series Va, possibly 1816, Tom Sharpe, 2014, personal commun.) is more fully and confidently colored. On this map, the Coral Rag appears and the Oaktree Clay is extended to the base of the Chalk. Smith’s Oaktree Clay is somewhat problematic; on the 1815 map legend, he shows “Blue Marl or Oak Tree Soil” beneath the Greensand and above the Purbeck stone. However, on his later cross sections, geological tables, and the county maps, the Oaktree Clay is clearly below the Portland stone and above the Clunch/Coral Rag, making it the equivalent of the modern Kimmeridge Clay. The changes in geological coloring are accompanied by new engraved geological lines. The third map is a composite of parts of Smith’s geological maps of Oxfordshire and Berkshire published between 1819 and 1820. The topographic and cultural information shown is more detailed because the county sheets are at a larger scale; the geological boundaries are also more detailed. For general comparison, the last map illustrates a simplified version of the modern geology published by the British Geological Survey.
Figure 2
Maps of the area around the city of Oxford showing the evolution of William Smith’s geological mapping and a comparison with the present day geological interpretation simplified from work by the British Geological Survey. (Extracts of William Smith county maps and the William Smith A map are published by kind permission of the Geological Society of London and the P map by kind permission of the Manuscripts and Special Collections, The University of Nottingham.)
Geological Significance of Smith’s Maps
William Smith did not make the first geological map. Jean-Étienne Guettard (1715–1786) and Philippe Buache (1700–1773) published a map in 1746 containing a large amount of regional lithological information that significantly shows an attempt at the distribution of the chalk in France and England. Later in the 1770s, Guettard and Lavoisier published a series of mineralogical maps of northeastern France showing point locations of rocks and minerals, but no attempt was made to map strata. Later, in 1809, the Scottish-American William Maclure (1763–1840) published a geological map of the United States that pre-dated Smith’s map by six years. Maclure was strongly influenced by the work of Abraham Gottlob Werner (1749–1817), who had developed a theory of universal rock genesis based on precipitation and erosion within a receding primordial ocean (later known as Neptunism). On his 1809 map, Maclure used Werner’s rock classification, which ultimately proved to be a geological cul-de-sac. Maclure did meet Smith in 1815 and purchased a copy of his map, yet he completely failed to understand the importance of Smith’s work (Torrens, 2001), for on his 1817 version of the USA map, the classification is essentially the same as the one he had used in 1809.
It is not known whether Smith was aware of Werner’s work, but if so, he was most certainly not influenced by it. Smith realized that an understanding of the “ordering of strata” was essential in geological mapping, and it was the application of his stratigraphic method that was so geologically significant. Smith first became interested in this ordering when employed as a surveyor on the Somerset Coal Canal in 1795. Through detailed study of canal sections, he managed to separate several repetitious clay formations and also to separate the Upper and Lower Oolite (Torrens, 2003, p. 161). By August 1797, Smith had made his first attempt at a more general order of strata, starting with Number 1 “Chalk Strata” and descending to Number 28 “Limestone” below the Coal Measures. In June 1799, at the home of the Rev. Joseph Townsend, Smith dictated his famous “Order of the Strata in the Bath area” to the Rev. Benjamin Richardson (Phillips, 1844, p. 29) and during the course of several iterations it evolved into the geological table, part of which is shown in Figure 3.
Figure 3
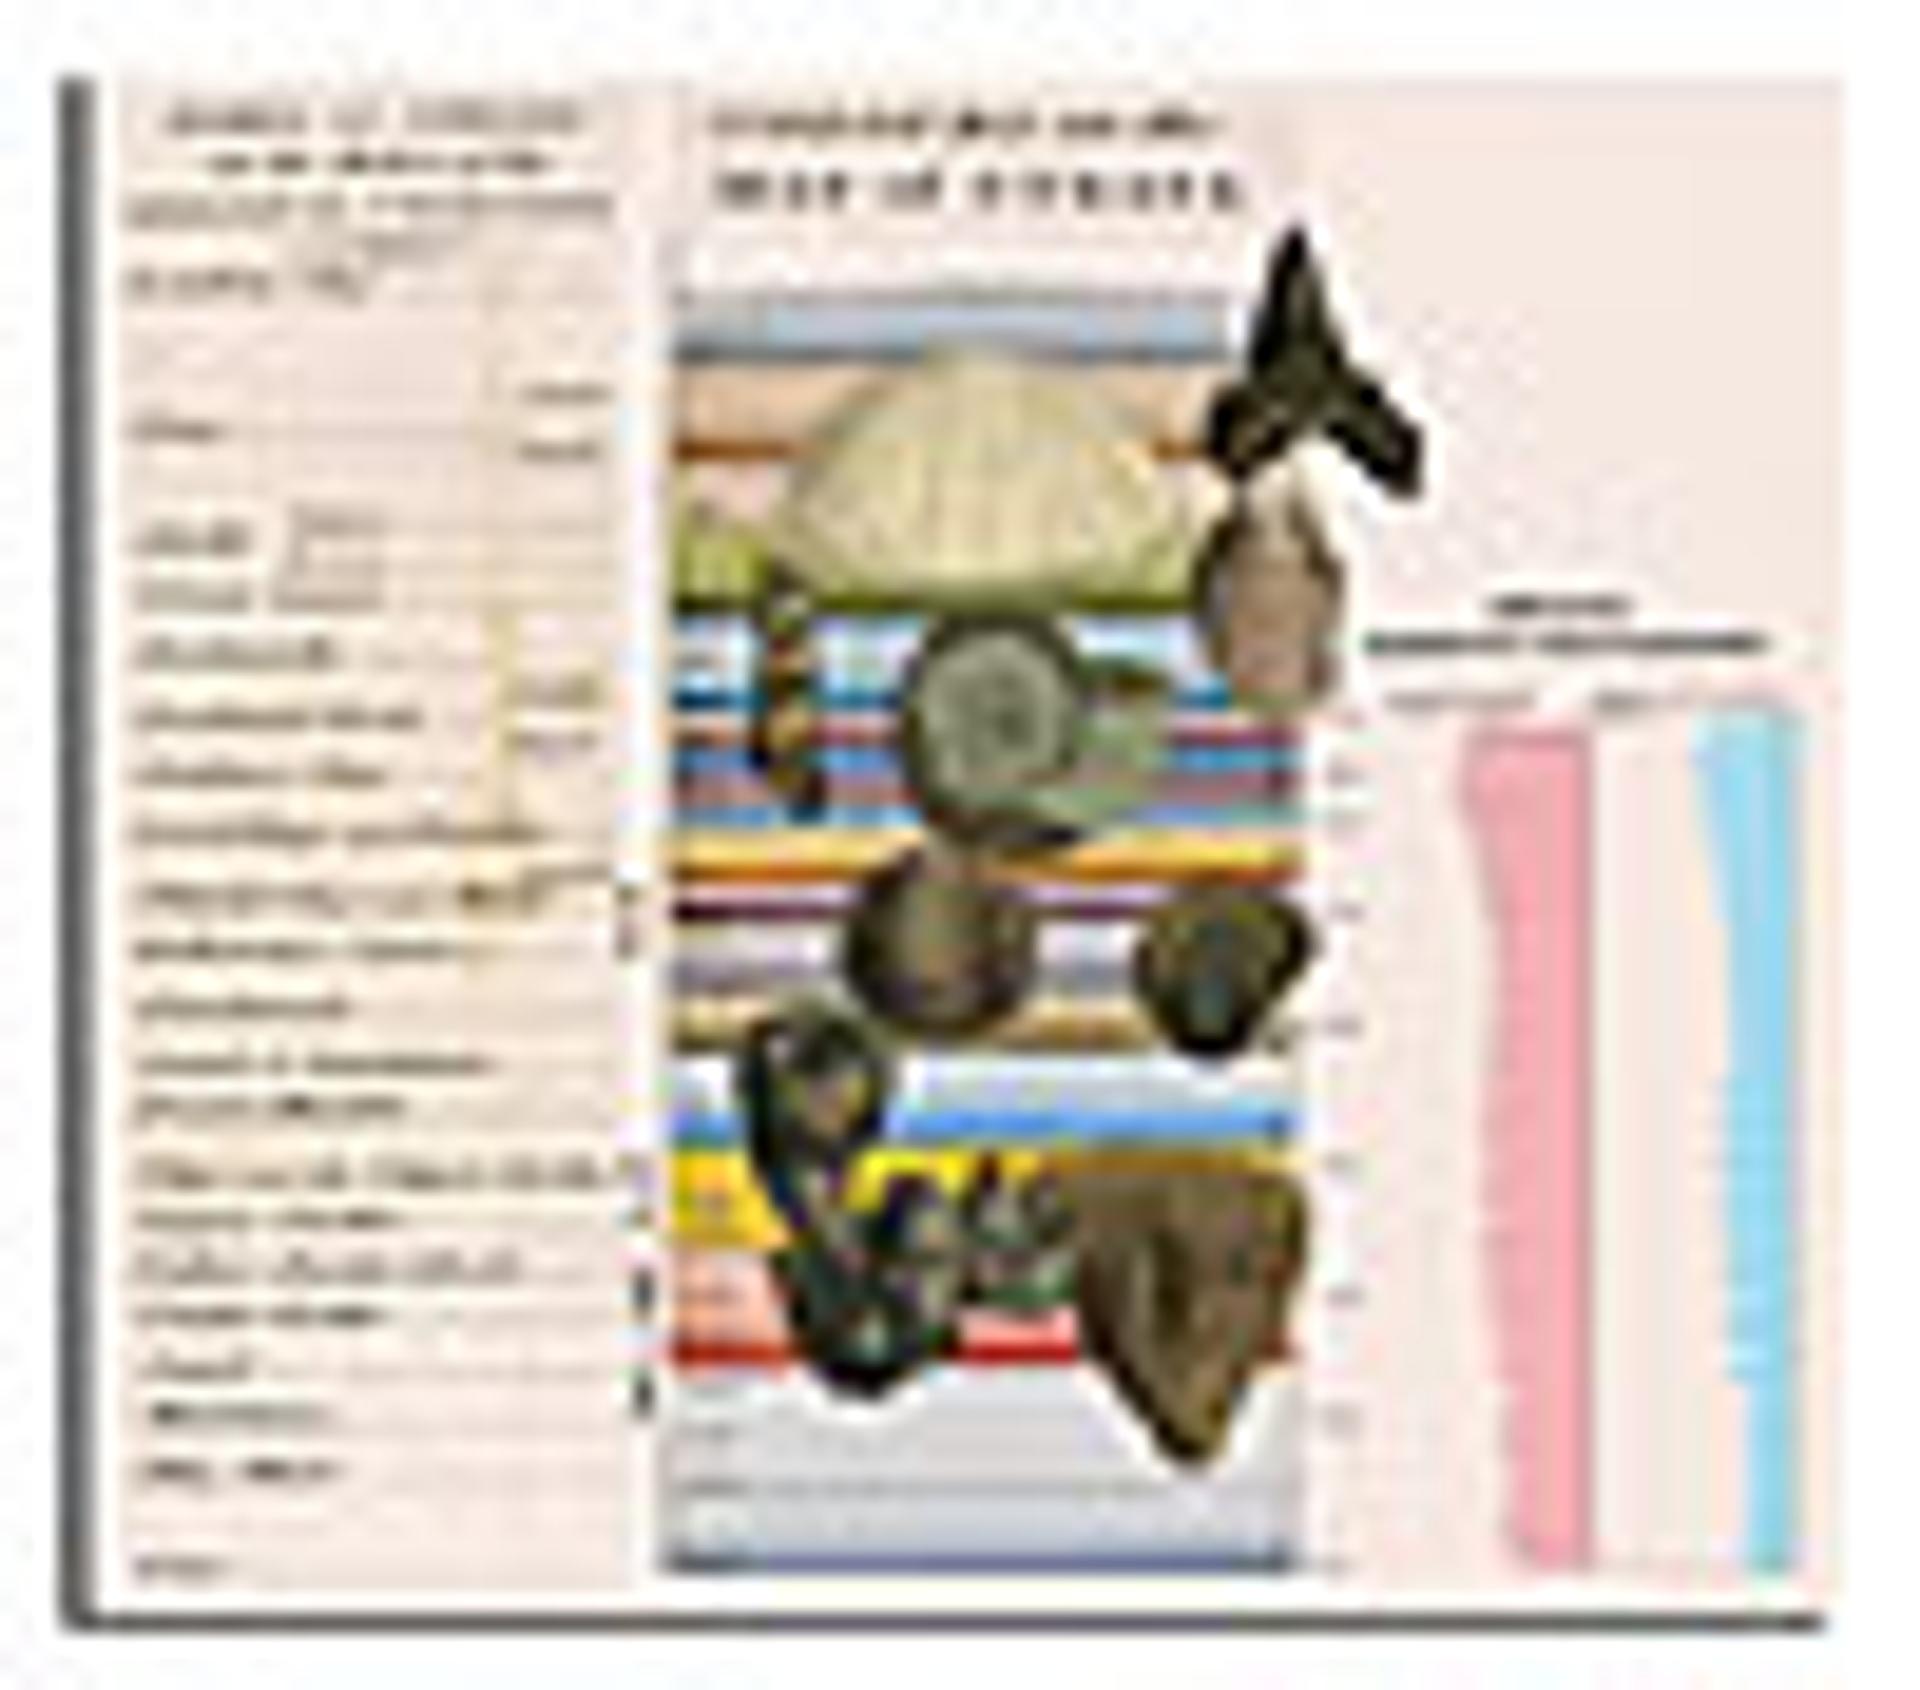
Composite illustration showing part of William Smith’s geological table of strata, some examples by Sowerby of stratigraphically arranged fossils from Smith’s 1816–1819 publication, “Strata Identified by Organized Fossils…,” and a modern stratigraphic sequence chart of the Jurassic (modified from Snedden and Liu, 2010).
Like others before, Smith could recognize strata based on their lithology, some rocks (e.g., oolites) being very distinctive. However the problem with a purely lithological approach to stratigraphy can be the incorrect correlation of strata of differing age but with similar lithology. Smith, however, realized early in his career that particular fossils were associated with each strata. He was an avid collector of fossils, but unlike the genteel collectors in Bath, did not see them as ornaments; to him, they were a key tool to identify and type specific strata in the geological record, and he built up a huge collection that he could relate to specific strata. Based on this, it can be fairly said that he founded the science of biostratigraphy. Some of Smith’s fossils from his 1816–1819 publication, “Strata Identified by Organized Fossils…,” are illustrated in Figure 3.
William Smith laid the foundation for stratigraphy in England; later, his pioneering work was to be continued by others. Of note were Carl Albert Oppel and Alcide d’Orbigny. Oppel provided a detailed zonation of the Jurassic by use of ammonites and was able to subdivide the Jurassic into 33 different zones (Oppel, 1856–1858). A major revolution in the understanding of stratigraphy came in the late twentieth century with the advent of high-resolution seismic acquisition. For the first time it became possible to resolve individual stratigraphic units and to understand their architecture; from this, the concept of sequence stratigraphy emerged. Figure 3 includes a diagram of Jurassic sequences, coastal onlap, and global sea-level change (0 = present day) compared to part of Smith’s Table of Strata. The science of stratigraphy has made significance advances during the past 200 years, yet for all these advances there is still a direct link back to William Smith’s original work.
Stratigraphy in Three Dimensions
Smith’s interest in representing geology in three dimensions can be traced back to his early career as a mine surveyor. In 1793, he proposed to make a reduced scale model of the Mearns colliery showing the coals and other strata (Phillips, 1844, p. 6). Later, Smith made a geological model by taking one of his geological maps and cutting along the edges of the strata in order to accentuate their relationships (Phillips, 1844, p. 27). He continued the three-dimensional theme in his magnificent stratigraphic cross sections. From 1817 on, he prepared and published a series of seven cross sections across England and Wales. Smith did not invent the geological cross section, for it is known that he was influenced by the pioneering work of John Strachey (Strachey, 1727, Fuller, 2004, p. 15). However, Smith took sections to a new level by combining a two-dimensional cross section with a three-dimensional panorama. Using modern digital technology, it is possible to further enhance these sections. The display in Figure 4 shows Smith’s section across the Weald of southern England, together with part of his 1815 map, which has been draped on a digital elevation model. Also shown is a modern composite seismic section (Butler and Jamieson, 2013). Smith’s cross section demonstrates the general anticlinal structure of the Weald with the chalk dipping to the north and the south. However, he wrongly interpreted the age of the thick section in the core of the anticline as Jurassic (Smith Strata Numbers 8–13). This was understandable because he had never before encountered thick strata between the Greensand-Gault and Portland-Purbeck stone. For obvious reasons, he could not have known that the Weald had been an actively subsiding basin during the Mesozoic, which had subsequently been inverted and unroofed. For all this, the cross section remains a remarkable achievement.
Figure 4
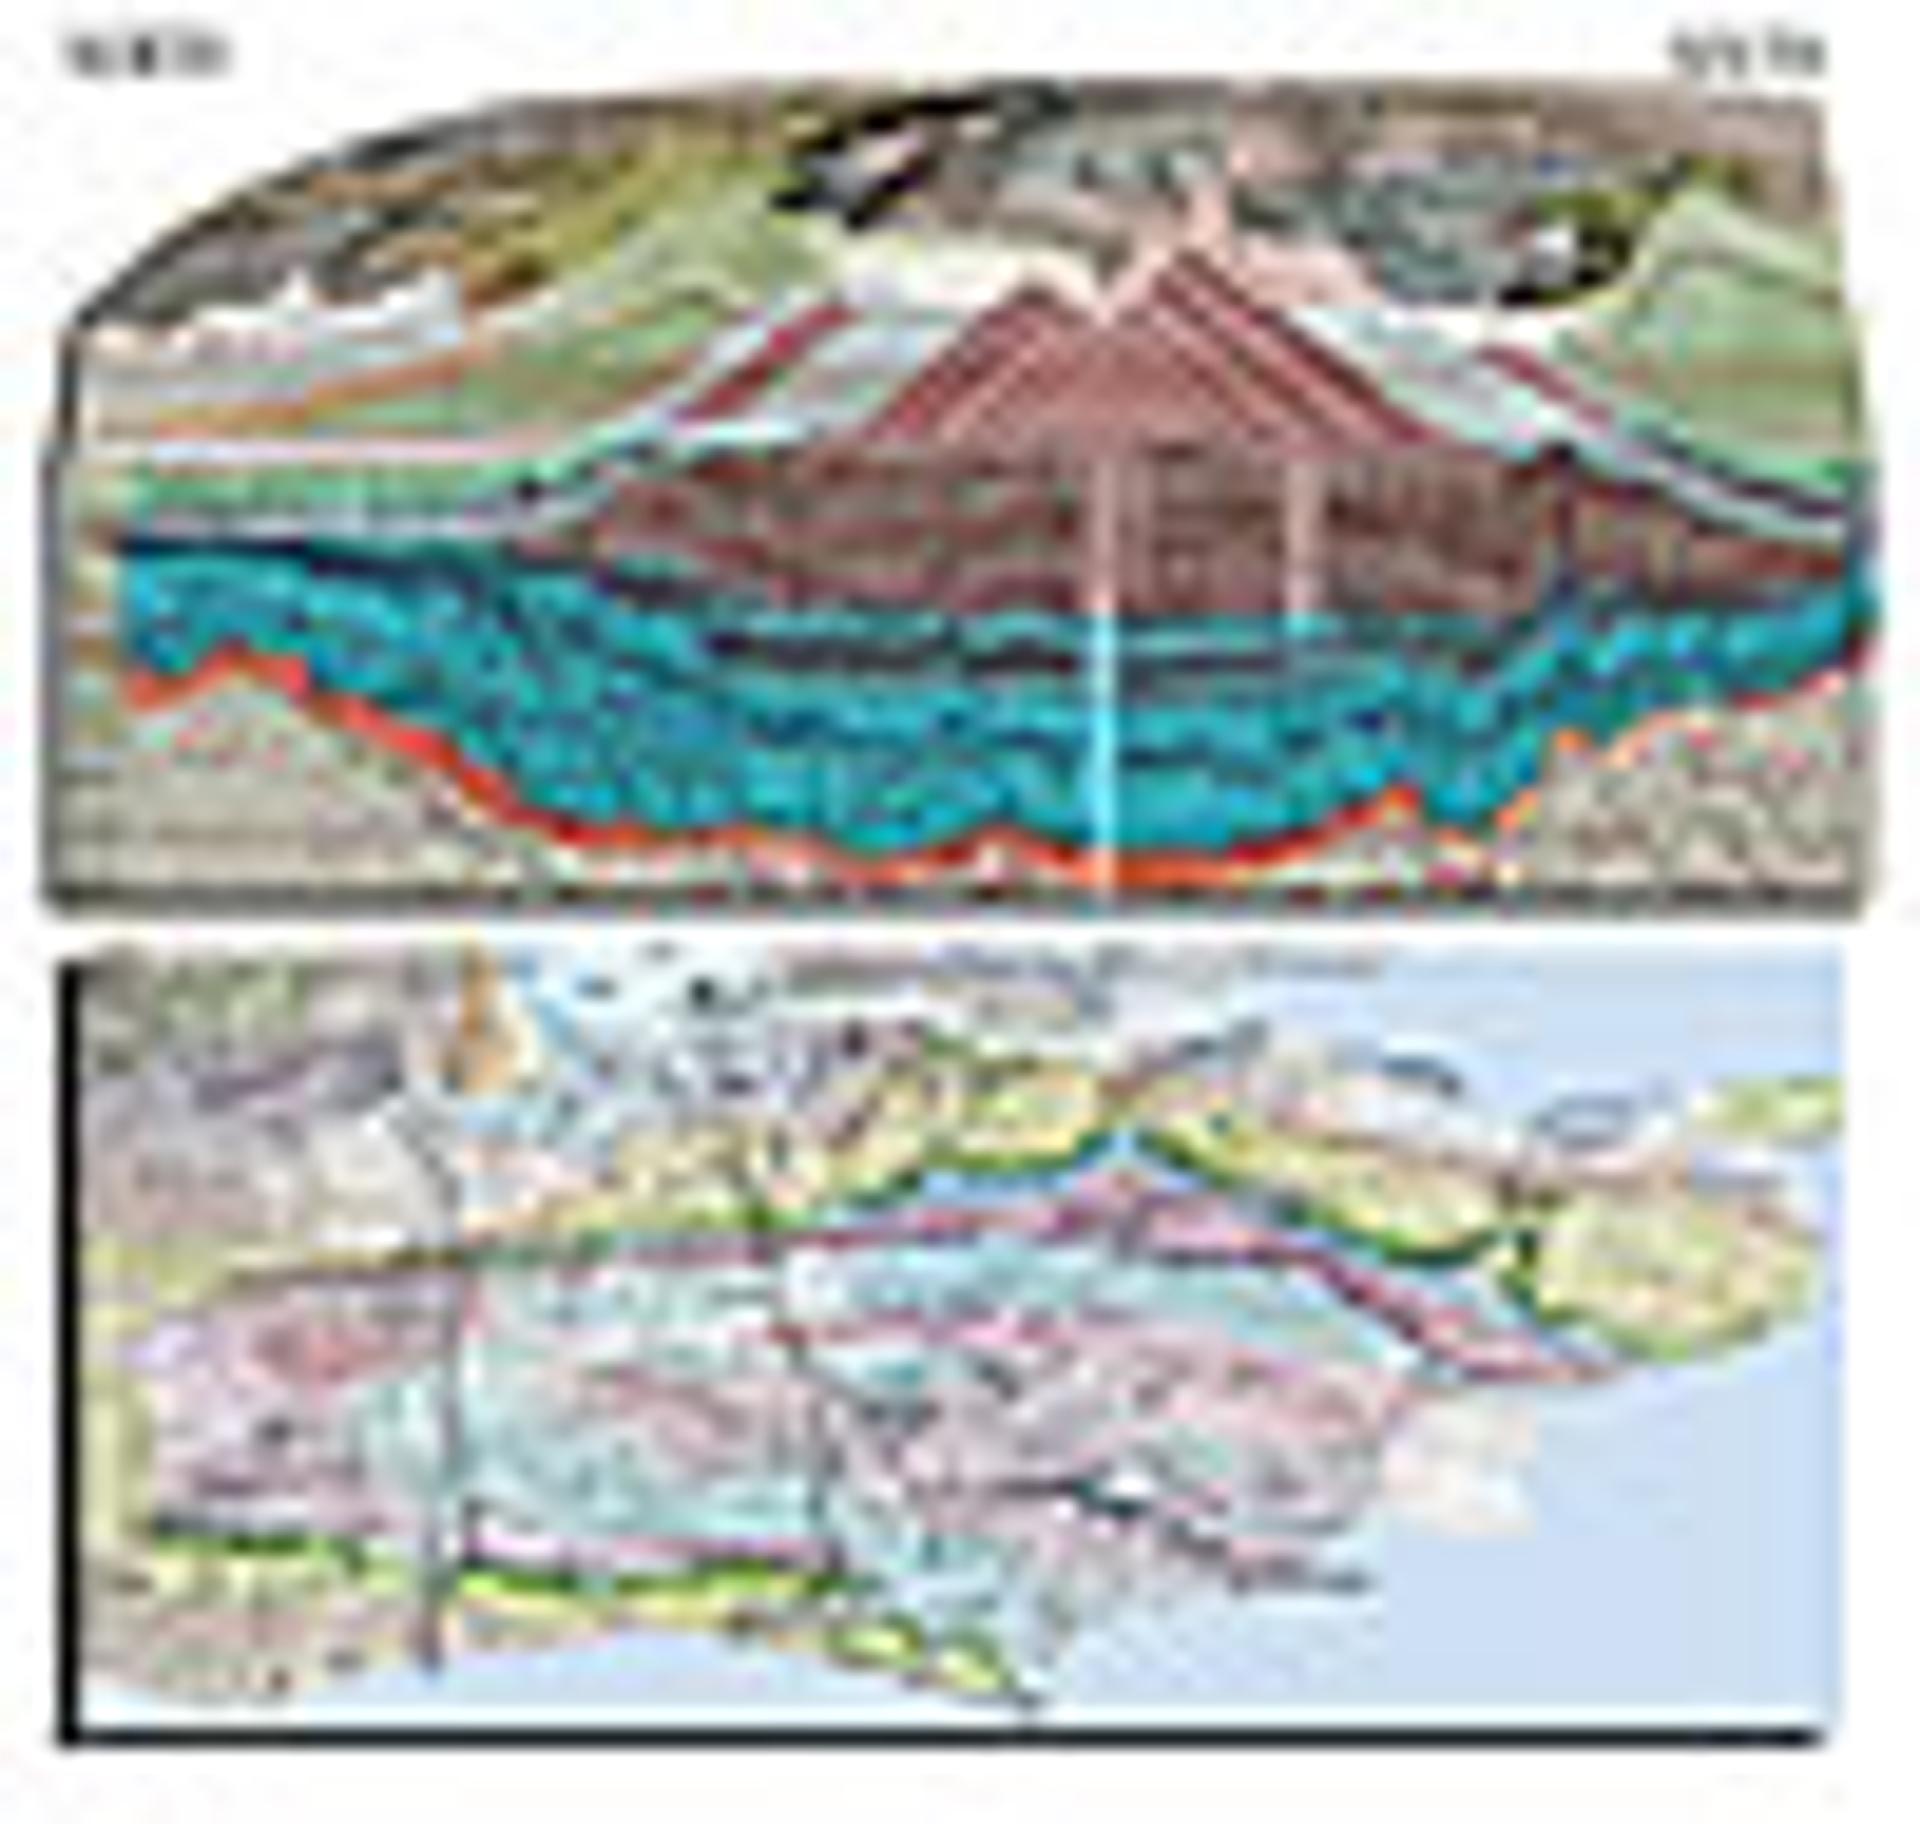
Part of William Smith’s 1819 Section of the Strata across Surrey and Sussex shown with part of his 1815 map, which has been draped on an SRTM elevation model. Also shown is a modern composite seismic section (modified from Butler and Jamieson, 2013). Green—Chalk; blue-gray—Greensand and Gault; pink-brown—Purbeck-Portland; blue—older Jurassic; orange-brown—Triassic. The locations of the seismic section (A–A´) and Smith’s section (B–B´) are shown on Smith’s county geological maps of Kent, Sussex, and Surrey.
Acknowledgments
The Smith GIS project has been generously funded by the UK Onshore Geophysical Library (UKOGL) and is available as a free-to-all educational resource at www.strata-smith.com. The author is extremely grateful to Hugh Torrens, Dave Williams, Tom Sharpe, John Henry, and Malcolm Butler for materials and content included in this paper. Extracts from the William Smith A map, county maps (Oxfordshire and Berkshire), and the William Smith P map are published by kind permission of the Geological Society of London and the Manuscripts and Special Collections, the University of Nottingham.
References Cited
- Butler, M., and Jamieson, R., 2013, Preliminary interpretation of six regional profiles across onshore basins of England: UK Onshore Geophysical Library, http://maps.lynxinfo.co.uk/docs/images/interpretations/.
- Cary, J., 1796, Cary’s Reduction of his large map of England and Wales with part of Scotland comprehending the whole of the Turnpike Roads with the great rivers and the course of the navigable canals: J. Cary, Engraver and Map-seller.
- Eyles, V.A., and Eyles, J.M., 1938, On the different issues of the first geological map of England and Wales: Annals of Science, v. 3, p. 190–212.
- Fuller, J.G.C.M., 2004, The origins of stratigraphy 1719–1801: London: Geologists’ Association Guide No 65, 53 p.
- Mudge, W., and Dalby, I., 1799, An account of the operations carried out for accomplishing a Trigonometric Survey of England and Wales from the commencement in the year 1784, to the end of the year 1796: London, Philosophical Transactions, vi + 205 p.
- Oppel, C.A., 1856, Die Juraformation Englands: Stuttgart, Frankreichs and des südwestlichen Deutschlands. 556 p.
- Oxford University Museum of Natural History (OUMNH) Archive and Library Collection, William Smith (1769–1839) Collection, Diaries 1789, WS/B0 p. 55.
- Phillips, J., 1844, Memoirs of William Smith LLD: London, John Murray, vii + 150 p.
- Sharpe, T., 2007, Sources of Maps, sections, other documents and digital data, in Wigley, P., Dolan, P., Sharpe, T., and Torrens, H.S., eds., 2007, ‘Strata’ Smith: His two hundred year legacy. Digitally enhanced maps and sections by William Smith, George Bellas Greenough, John Cary and Richard Thomas 1796–1840: London: The Geological Society, DVD.
- Smith, W., 1815, A Memoir to the Map and Delineation of the Strata of England and Wales with part of Scotland: London: Cary, facsimile reprint, History of Geology Group of the Geological Society, 2015 + 26 p. introduction.
- Smith, W., 1816–1819, Strata Identified by Organized Fossils containing prints on colored paper of the most characteristic specimens in each stratum: London, W. Arding, 59 p.
- Snedden, J.W., and Liu, C., 2010, A compilation of Phanerozoic sea-level change, coastal onlaps, and recommended sequence designations: AAPG Datapages, Search and Discovery article #40594, 20 Aug. 2010, http://www.searchanddiscovery.com/documents/2010/40594snedden/ndx_snedden.pdf (last accessed 9 May 2016).
- Snyder, J., 1993, Flattening the Earth; Two Thousand Years of Map Projections: Chicago, The University of Chicago Press, 365 p.
- Strachey, J., 1727, Observations on the different strata of Earths and Minerals: London, Walthoe.
- Tooley, R.V., 1952, Map and Map Makers: London, B.T. Batsford, p. xii, 140 p., plus plates.
- Torrens, H.S., 2001, Timeless order: William Smith (1769–1839) and the search for raw materials 1800–1820, in Lewis, C.L.E., and Knell, S.J., eds., The age of the Earth from 4004 BC to AD 2002: Geological Society of London Special Publication 190, p. 61–83.
- Torrens, H.S., 2003, An introduction to the life and times of William Smith (1769–1839), in Memoirs of William Smith LL.D., author of the “Map of the Strata of England and Wales” by his nephew and pupil John Phillips, F.R.S., first published in 1844. Reprint: Bath, Bath Royal Literary and Scientific Institution. p. xi–xxxviii.
- Torrens, H.S., 2007, Notes on the Maps of William Smith (1815 onwards), George Bellas Greenough (1820 and 1840) and John Cary (1794 & 1796), in Wigley, P., Dolan, P., Sharpe, T., and Torrens, H.S., eds., 2007, ‘Strata’ Smith: His two hundred year legacy: Digitally enhanced maps and sections by William Smith, George Bellas Greenough, John Cary and Richard Thomas 1796–1840: The Geological Society, London, DVD.
