
Deriving a Water Height Acceleration Threshold for Improved Flash Flood Alerts in the Upper Guadalupe River
Meredith L. Swallom and Jason M. Dortch
In this article
Authors
Meredith L. Swallom*
Kentucky Geological Survey, University of Kentucky, Lexington, Kentucky 40506, USA
Jason M. Dortch
Kentucky Geological Survey, University of Kentucky, Lexington, Kentucky 40506, USA
Abstract
Flash flooding along the Guadalupe River (Texas, USA) on 4 July 2025 caused more than 130 fatalities, highlighting a tragic pattern of casualties that occur despite flood alerts and community action. This pattern persists because county-scale warnings can be poorly aligned with watershed boundaries, rely on cell phone coverage, and often arrive noncoincident with flood surges. To address these challenges, a more rigorous criterion for flood alerts should be established. It should have clear meaning to residents in specific watersheds and be met before flooding is underway so that earlier action can be taken. In this study, stream gage data from an October 2018 flood were used to derive a water height acceleration threshold (WHAT), which tracked initial surges of floodwaters that resulted in flash flooding along the upper Guadalupe River. This threshold was applied to a more severe July 2025 flood to determine when theoretical gage-specific alerts could have been issued for the greatest efficacy. All gages, even those that were damaged and stopped providing data during the July 2025 flood, exceeded their WHAT before substantial flooding occurred at their locations. Upstream gages would have provided more notice (5.5 h) ahead of major downstream flooding as well as response time (1.16–2.25 h) at those upstream locations themselves. We posit that the WHAT framework can be integrated into flood alerting procedures and emphasize the importance of gage location in implementation.
* meredith.odell@uky.edu
CITATION: Swallom, M.L., and Dortch, J.M., 2026, Deriving a Water Height Acceleration Threshold for Improved Flash Flood Alerts in the Upper Guadalupe River: GSA Today, v. 36, no. 11, p. 4–10, https://doi.org/10.1130/GSATG647A.1.
© 2026 The Authors. Gold Open Access: This paper is published under the terms of the CC-BY-NC license. Printed in the USA.
Introduction
Inefficacy of Flash Flood Alerts
Headwater basins embedded in steep, high-gradient river networks are vulnerable to riverine flash floods, which often manifest rapidly overnight, catch floodplain residents off guard (Dryden et al., 2021; Tellman et al., 2021; Thieken et al., 2023), and have the highest fatality rate of all flood types (Jonkman et al., 2024). National Weather Service (NWS) alerts are commonly issued (>3,000 nationwide in 2025 alone) at the county level by regional forecasting centers, but these alerts do not always prompt rapid evacuations (Samansiri et al., 2023; Chow, 2025) due to lack of cell phone coverage or warning fatigue. Warnings are based on precipitation and stream gage response, but U.S. Geological Survey (USGS) gages often lie on high-order streams near population centers and do not always capture the hydrologic signal of a major storm until late in the event. Further, differences between alert types (flash flood warning, flash flood emergency, flood warning, flood advisory, and flood watch; NWS, 2025) may not be intuitive to the public. Flash flood warnings issued when rain is not falling locally may be perceived as inaccurate (Tanaka et al., 2026), and residents may not take urgent action. Flood-prone communities have frequently emphasized the need for infrastructure-heavy local alert systems (Kofsky, 2025), but these technologies are inaccessible for many rural populations owing to high costs. A global decrease in per-event flood fatalities in recent years may be due to increased risk reduction efforts and infrastructure in affluent communities (Jonkman et al., 2024), but rural floodplain communities lacking the financial resources to implement advanced solutions or relocate critical infrastructure (Chang et al., 2023) remain vulnerable to future extreme precipitation, rapid runoff concentration, and associated fatalities (Trenberth et al., 2003; McDermott, 2022).
Kerr County Flood, 4 July 2025
In Kerr County, Texas, despite at least 22 NWS alerts issued between 1 a.m. and 4 p.m. on 4 July 2025 (Iowa Mesonet, 2025; see Table S1 in the Supplemental Material1), rising waters caught sleeping communities off guard and claimed at least 119 lives (Kumar, 2025). The first flash flood warning came at 1:14 a.m. from the NWS Austin/San Antonio forecast office (Fig. 1A). The next warning, the first to be based on stream gage response (though the alert did not reference a specific gage location), was issued at 3:35 a.m., more than an hour after flooding began at Camp Mystic (Fig. 1B, Gerberg et al., 2025), a summer camp ~20 km southwest of Kerrville. At 4:03 a.m., a flash flood emergency notification urged residents of Hunt and Ingram to seek higher ground, but no rain was falling at Kerrville (Fig. 1B; Emanuel, 2025). Local flooding was reported in Kerrville by ~5 a.m., and at 5:34 a.m., the NWS declared a flash flood emergency for Kerr County (Iowa Mesonet, 2025). Between 6:06 a.m. and 3:56 p.m., another 18 countywide alerts were issued. Though local law enforcement and public officials worked to alert the public and prompt evacuations once it became clear that urgent action was necessary, flooding had already severely impacted upstream communities (Gerberg et al., 2025; Hawes, 2025).
Figure 1
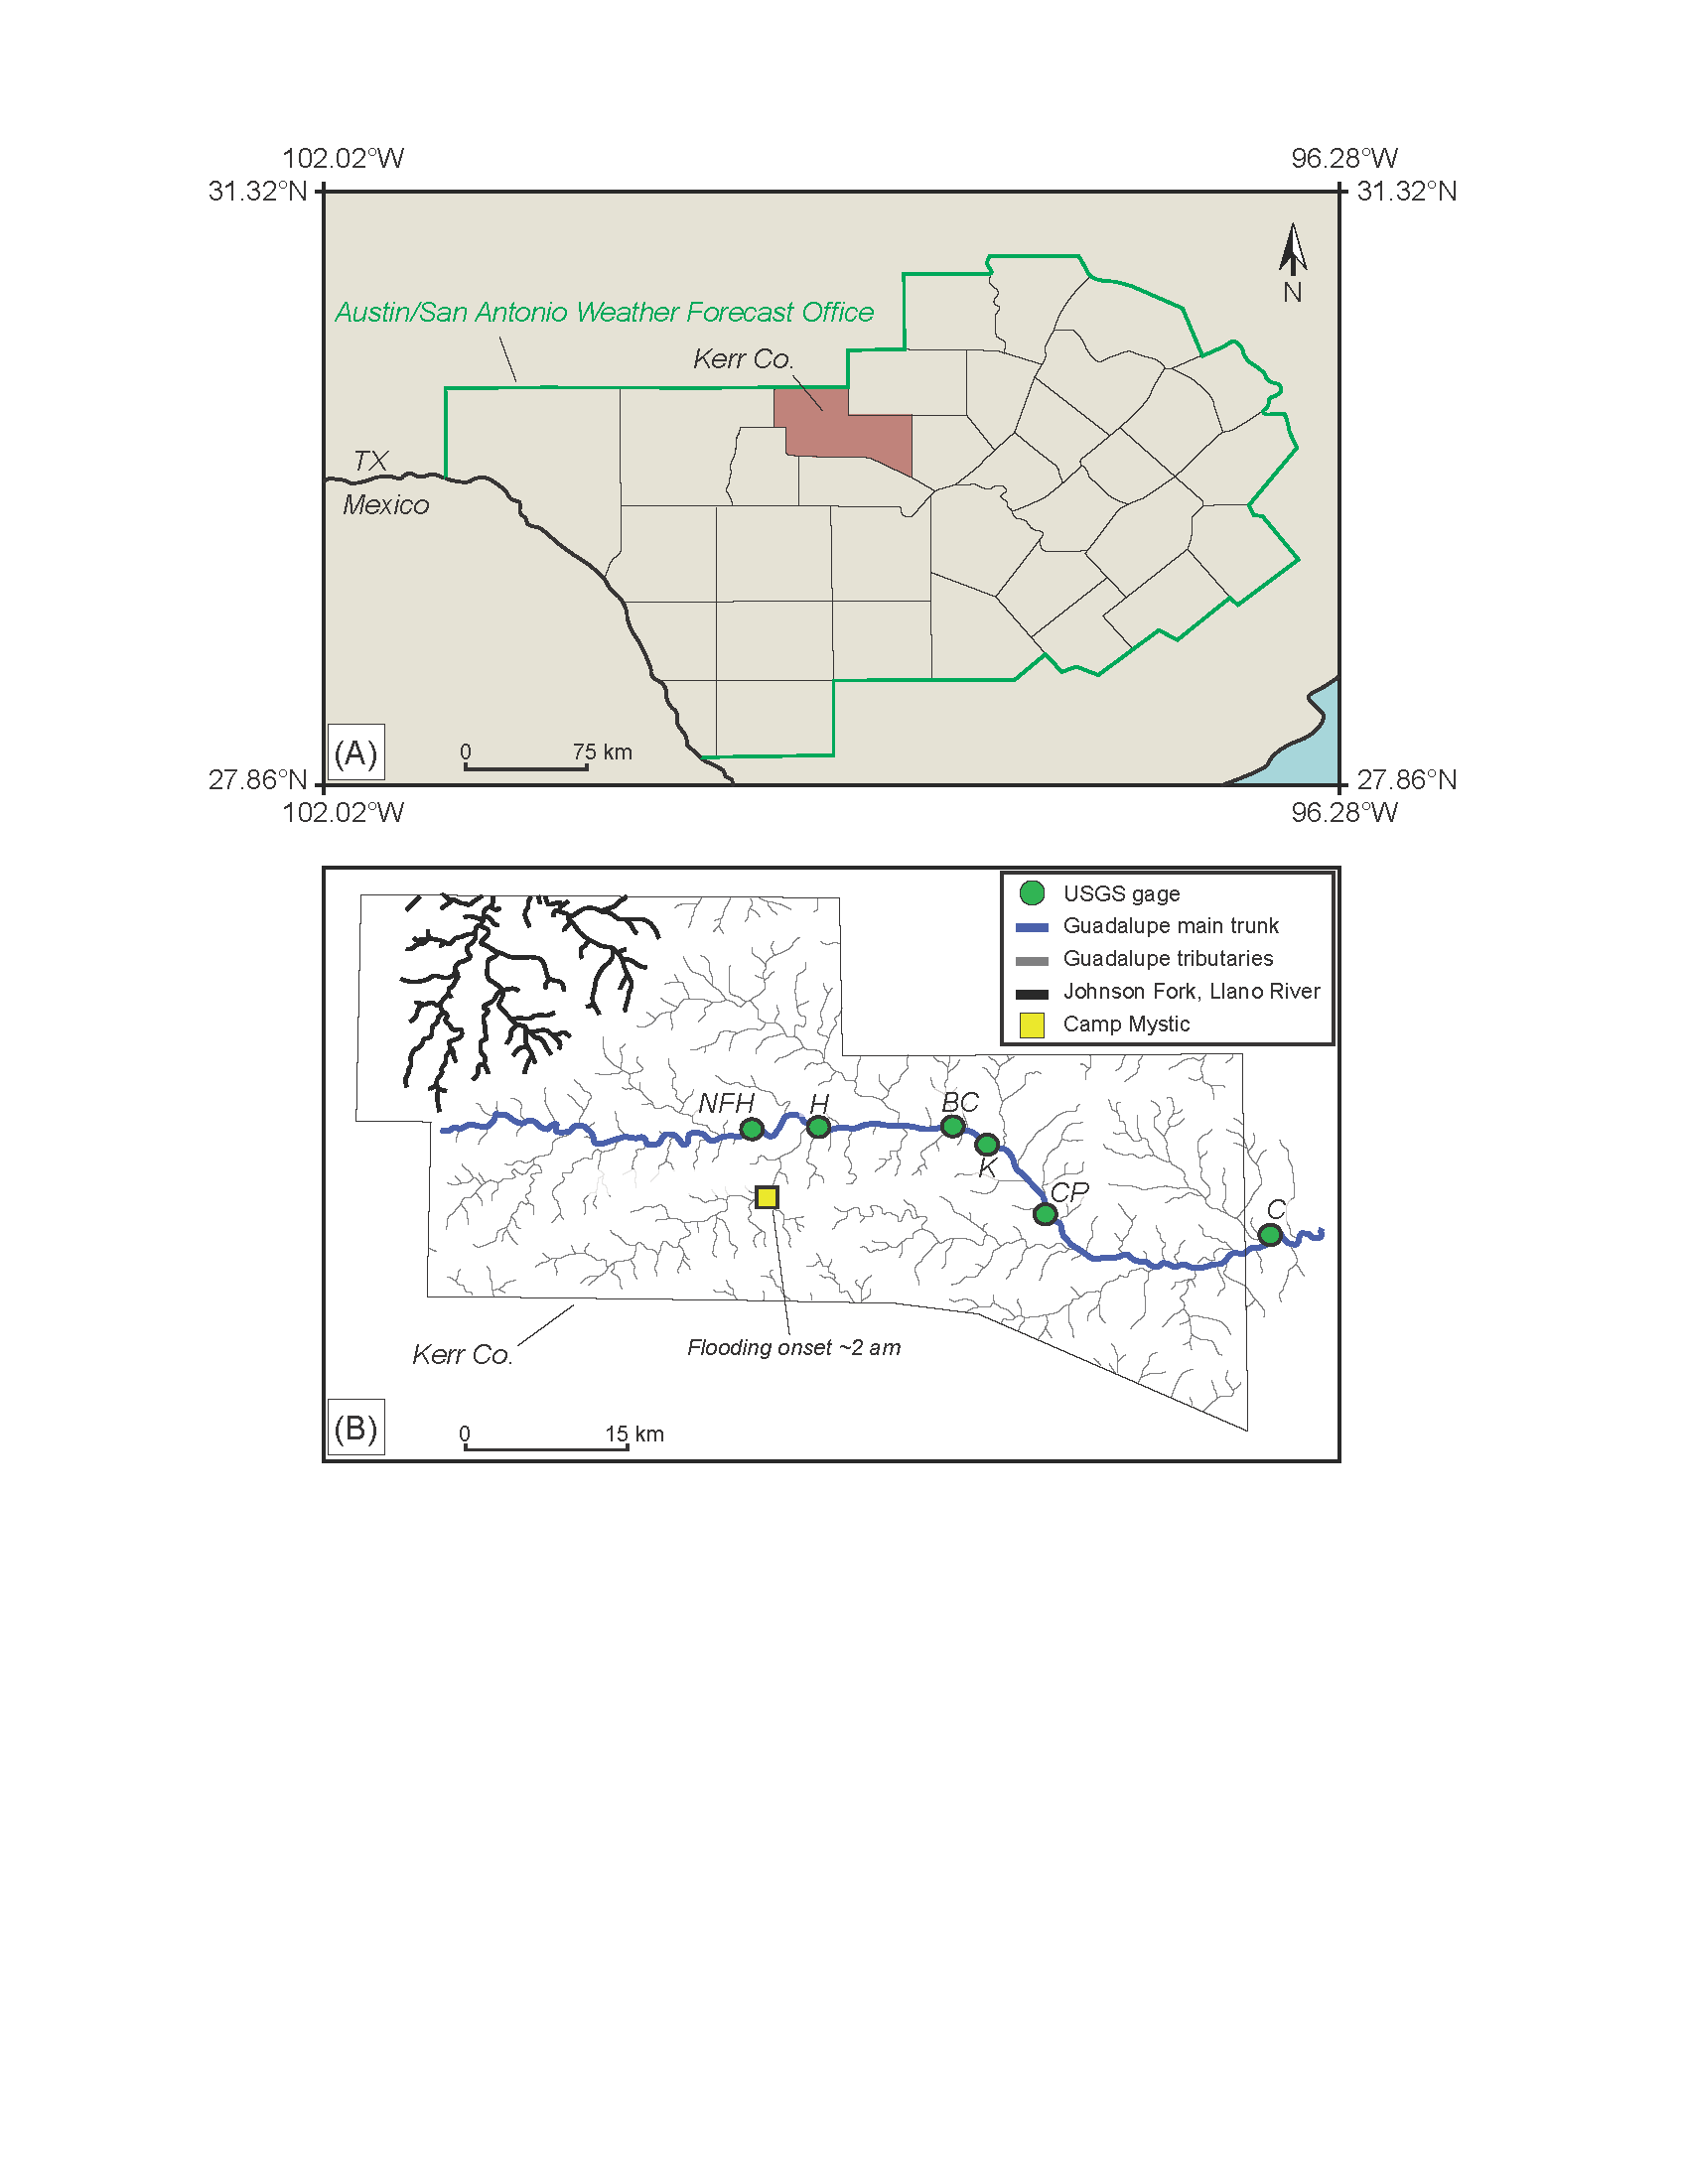
(A) Austin/San Antonio weather forecast office jurisdiction outlined in green, with Kerr County in brown. (B) Kerr County and river network. USGS gage site numbers (NFH—North Fork at Hunt; H—Hunt; BC—Bear Creek; K—Kerrville; CP—Center Point; C—Comfort) are provided in Table 1. The Johnson Fork of the Llano River, most impacted by an October 2018 flash flood, is detailed in black.
Study Aim
Due to a lack of consistent, effective alerting (Thieken et al., 2023; Hawes, 2025) during extreme precipitation-related floods, there is a clear need for intuitive alerts to be issued to watersheds rather than counties and be based on upstream hydrologic responses (Fig. 1B). Tailored alerts based on stream hydrology are possible via the USGS WaterAlert service but are based on user-defined gage height thresholds to accommodate a variety of intended data applications (USGS, 2025). Most users neither have sufficient hydrologic context to identify which gage may best represent their flood-risk tolerance (if they attempt to use WaterAlert for this purpose as opposed to recreational or scholarly activities), nor will they know which gage heights should serve as thresholds, as these vary along the river profile.
To address these systemic limitations, we propose that
- a straightforward criterion for fewer but more meaningful alerts in advance of rising water should be established for individual gages;
- gages used for alerts should be upstream of recipients; and
- messaging related to alert criteria and origins must be intuitive to the public (i.e., warning messages must be understandable without additional documentation) so that alerts will be heeded.
Here, the hydrologic record is used to derive water height accelerations, which may signal flash floods and are a function of precipitation, antecedent soil moisture, stream order, and other factors that normally complicate the efficacy of regional alerts. We demonstrate a forensic alert-timing reconstruction for the catastrophic July 2025 Kerr County flood, confirming the method’s ability to track surge-onset signals even prior to gage failure. Though the lack of headwater gage infrastructure remains a challenge nationally, this study highlights that physically interpretable flood-surge onset signals can be extracted from existing gages to increase lead time and serve as a transferable alert-thresholding framework for other regions.
Methods
Flooding is a result of the interaction of precipitation patterns at event-specific intensification rates, drainage morphology, gradient, antecedent soil moisture (Saco et al., 2021), debris (Wilford et al., 2004), vegetation (Bosch and Hewlett, 1982), and land use (Rogger et al., 2017; Swallom et al., 2025). These variables are spatially and temporally variable across regions, watersheds, and individual tributaries (Jensen and Pederson, 2005; Cristiano et al., 2017), and incorporating them into flash flood forecasting is resource intensive and computationally difficult. Hydrologic response in river channels is the result of all these factors (McManamay, 2022) and, if a meaningful threshold is determined, could serve as the basis for watershed-specific flash flood alerts. To establish such a threshold, hydrologic response at gages must be benchmarked relative to prior flood events. Major floods on record in Kerr County include events in 1932 and 1987 (Baker, 2025; Duvoisin, 2025), though the earliest gage data are from 1990. Floods affected the lower Guadalupe catchment in 1991 and 1998 (Guadalupe-Blanco River Authority, 2021), but the instantaneous data needed to develop a detailed temporal understanding of hydrologic response were not available until 2007. Within the hydrologic record, only the 16 October 2018 and 4 July 2025 flash floods impacted all six gages in the upper Guadalupe catchment, and one flood in April 2010 captured response at five gages (Figs. 1 and S1). We define catchment/countywide flash floods as events where multiple gages with defined minor flood stages (Hunt at 10 ft, Kerrville at 9 ft, Comfort at 21 ft) all exceeded these thresholds, indicating widespread flooding most comparable to the scale of traditional weather alerts. The 2018 flood was devastating along the Llano River, northwest of the Guadalupe catchment (Currie and Henrikson, 2020; Fig. 1B). In Kerr County, this event was severe enough to close low water crossings and prompt monitoring of water treatment plants but did not result in loss of life (Garcia, 2018), making it well-suited for thresholding. If thresholds representative of the 2018 flood can be established for each gage, they may inform future alerts and initiate life-saving action. To investigate gage responses during the October 2018 event, 15 min USGS gage height data were extracted between 12 and 18 October to capture the full hydrologic signature of the flood.
Gage height is spatiotemporally variable, and a single threshold is difficult to apply at various locations along a river. Further, increases in gage height downstream are often delayed with respect to precipitation. By the time a height threshold is achieved at downstream gages, flooding is already under way, and response time is limited. To address spatial variability in gage heights, derivatives can be calculated. The 1st derivative represents the rate at which water level is changing (Deboeck et al., 2009) and has more potential implications for flash flooding than gage height alone.

where h is the gage height at time t.
Gage heights can increase quickly for short periods of time due to spatially variable precipitation (Junk et al., 1989) or tributary pulses (Acharya et al., 2023), so 1st derivatives alone may result in over-warning and a continued lack of confidence in alerts. To distinguish sustained flood surges from transient fluctuations, we calculate the 2nd derivative (acceleration) from these 1st derivatives. Appreciable deviations from an acceleration of zero (Table S2) should represent substantial surges rather than short-lived fluctuations and may isolate an early hydrologic pulse (Junk et al., 1989) during flash floods. The 2nd derivative is calculated by

where d is the 1st derivative of gage height at time t.
A 2nd derivative spike precedes the resulting gage height increase by 45 min (three 15 min observations) in this study, potentially providing valuable time ahead of rising waters and often-associated broken gages (Fig. 2). Though accelerations are conventionally expressed in m/s2, they are expressed here in ft/hr2 because converting to seconds yields numerically unstable precision, producing vanishingly small values.
Figure 2
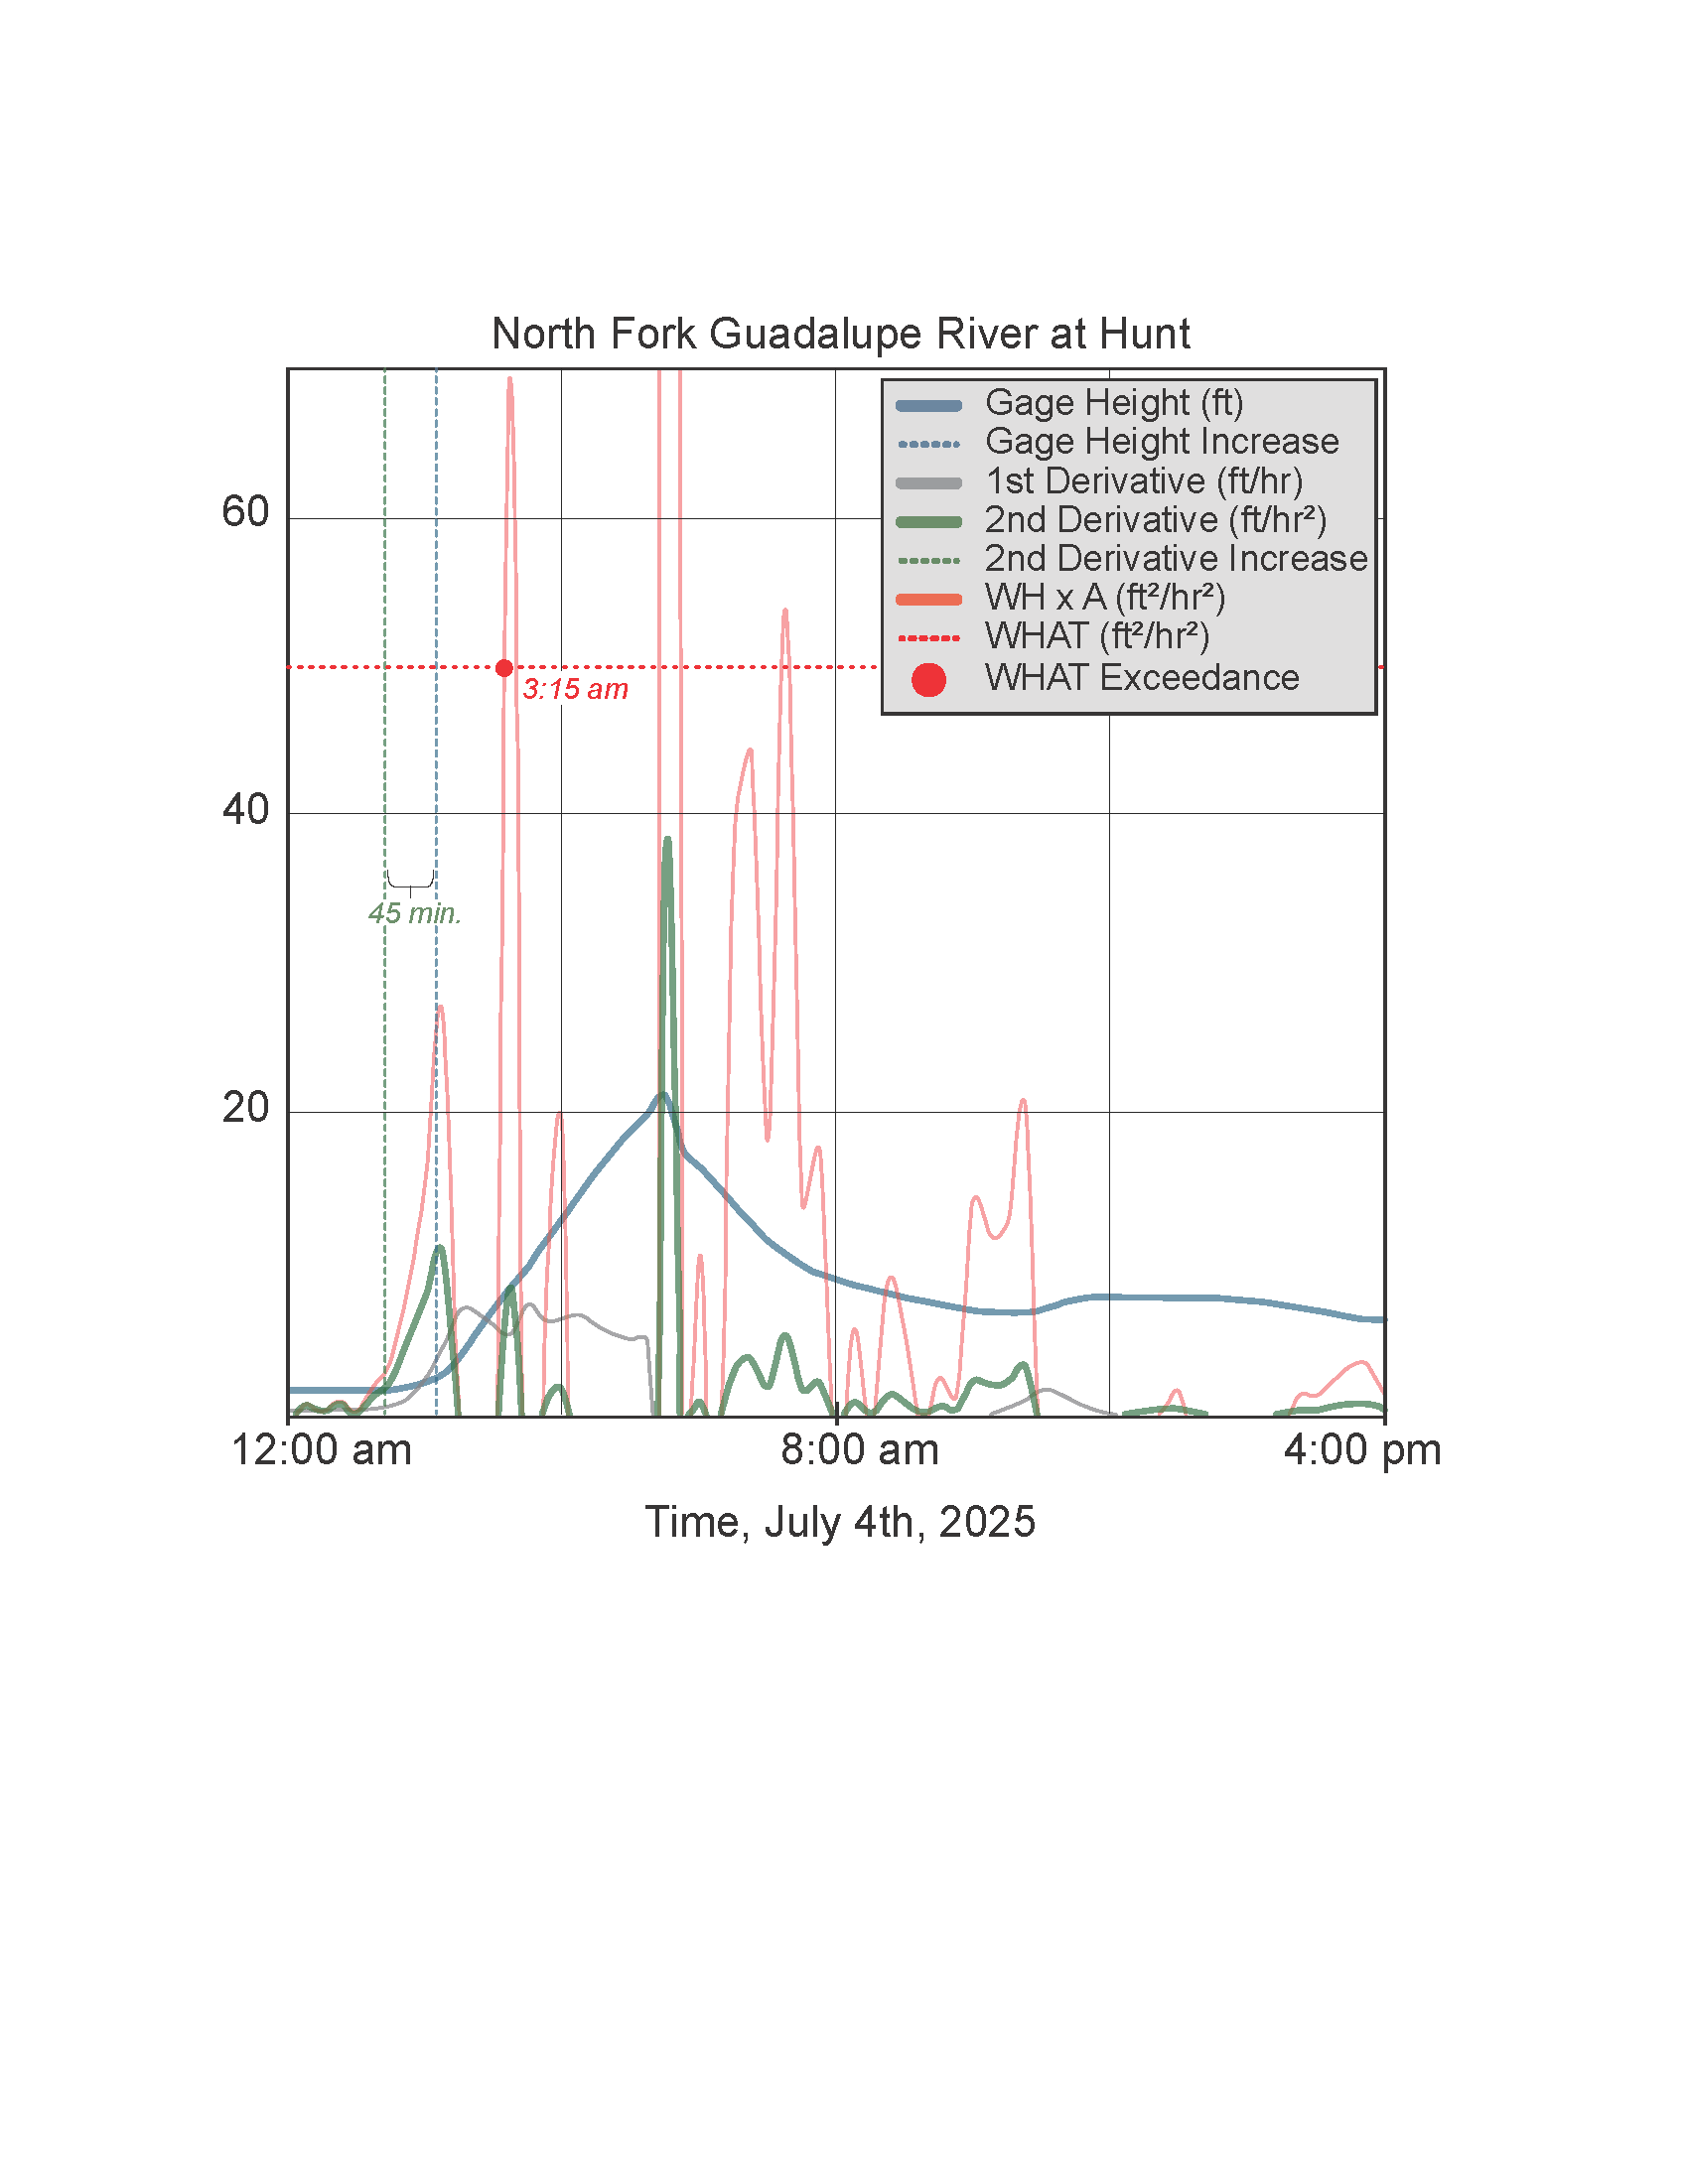
Gage height, 1st and 2nd derivatives, and WH × A at USGS site no. 8165300 on 4 July 2025. A temporal lag of three 15 min observations between 2nd derivative and gage height increases equates to 45 min of additional response time afforded by considering acceleration as opposed to heights alone. The earliest WHAT exceedance (when gage height times its 2nd derivative was greater than 50.4 ft2/hr2) at this gage during the 4 July flash flood was at 3:15 a.m.
Finally, acknowledging that an increased acceleration value alone may not signal an imminent flash flood event, each acceleration was multiplied by the gage height at the same observation time.

This measure hedges against potential over-alerting (e.g., a high acceleration value may not signal a flash flood in a normally low-flow tributary with ample channel capacity). To identify a flood-related threshold, Equation 3 was applied to the hydrologic record, and the maximum response from the October 2018 flood event was extracted, as this represents the most extreme hydrologic pulse during this significant (but not deadly) flash flood. In future scenarios, any water height × acceleration (WH × A) exceeding this threshold may indicate a potential flash flood at least as severe as that of October 2018. These thresholds are hereafter referred to as water height acceleration thresholds (WHATs) and are expressed with units of ft2/hr2. After determining gage-specific WHATs, 2nd derivatives were calculated for six gages (Fig. 1B) over the 2007–2025 hydrologic record and multiplied by water height. WH × A values exceeding the October 2018 WHAT (Table 1) during the July 2025 event are interpreted as the earliest possible indication of a flash flood (Fig. 3A). A discussion of all WHAT exceedances from 2007 to 2025 is included in the Supplementary Information.
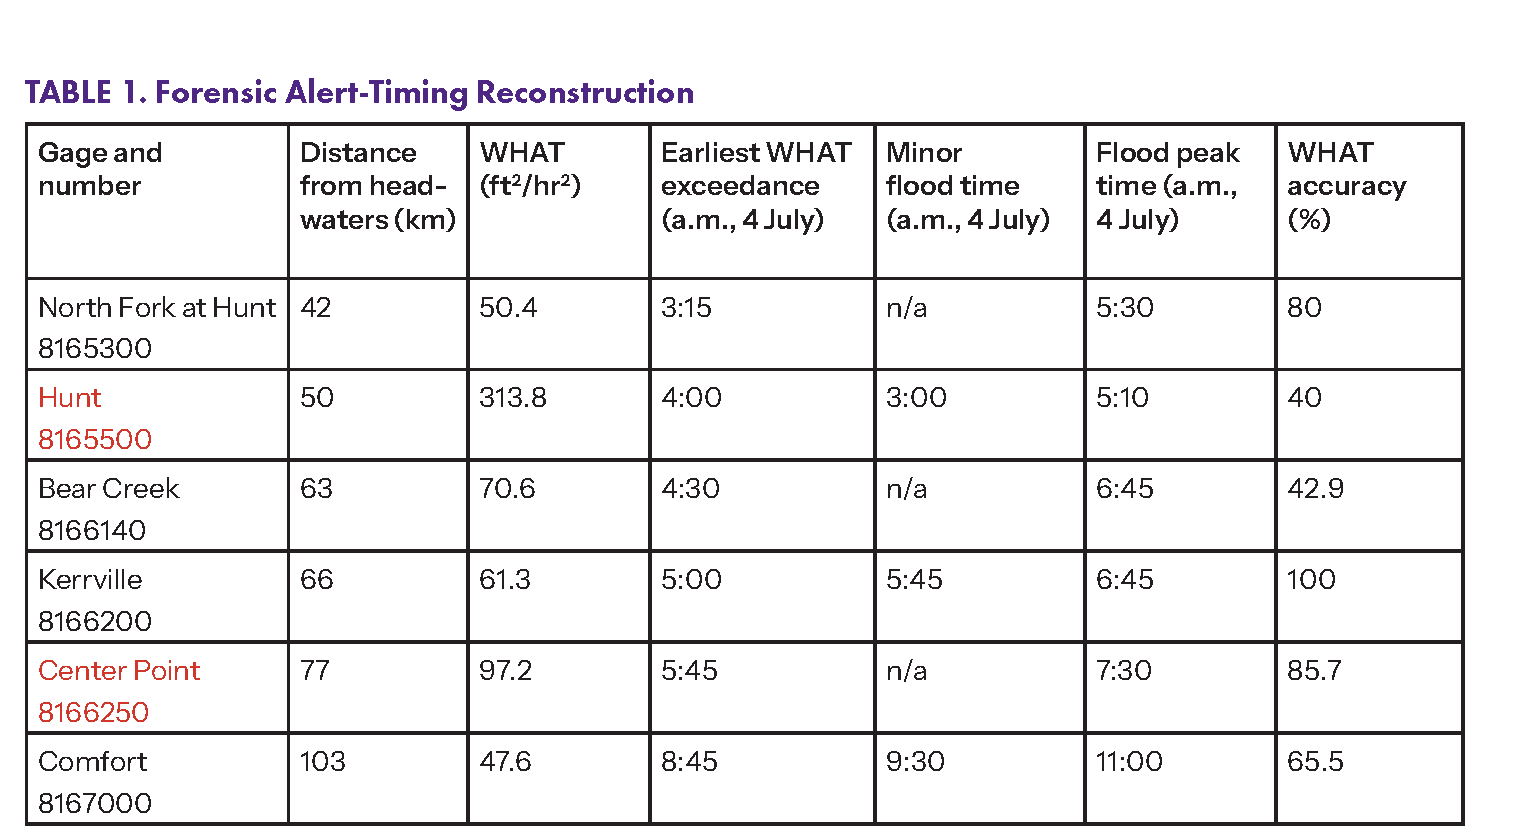
Note: An October 2018 flood serves as the reference event for establishing water height acceleration thresholds (WHATs). “Earliest WHAT alert” represents the first time that each WHAT was exceeded ahead of 4 July 2025 flooding. “Minor flood time” denotes the time that gage height reached this gage-specific level. Gages in red text broke during the July 2025 storm.
Results
October 2018-Derived Thresholds (WHATs)
Background 2nd derivative values during non-flood periods averaged near zero at all gages (0 ± 1.5 ft/hr2; Table S2), indicating that WHAT exceedances should represent statistically significant deviations from baseline conditions. Maximum WH × A values during the October 2018 flash flood, serving as WHATs for theoretical alerts, were 50.4 ft2/hr2 at the North Fork at Hunt gage, 313.8 ft2/hr2 at Hunt, 70.6 ft2/hr2 at Bear Creek, 61.3 ft2/hr2 at Kerrville, 97.2 ft2/hr2 at Center Point, and 47.6 ft2/hr2 at Comfort (Table 1).
WHAT Exceedances as Theoretical Alerts
Across all six gages, 84 WHAT exceedances occurred between October 2007 and July 2025 (Table S3). A summary of gage-specific flood relevance and threshold exceedances is consolidated in Table 1. The gage nearest the headwaters (North Fork at Hunt) exceeded its WHAT five times (Table S3). Three were associated with the July 2025 flood (Fig. 3A). One exceedance was associated with the October 2018 flash flood (Fig. 3B), and one occurred in the week prior to the October 2018 flash flood. Altogether, 80% of WHAT exceedances at this gage were associated with known countywide flash floods. At Hunt, one of five total exceedances occurred on 4 July 2025, one occurred ahead of the October 2018 flood, and the remaining three occurred in May 2021, July 2021, and July 2024 (Fig. S1; 40%). At Bear Creek, 10 of 28 exceedances occurred during the July 2025 flood, one occurred during the October 2018 flood, and one preceded the April 2010 flood (42.9%). Kerrville saw 9 of 10 total WHAT exceedances on 4 July 2025. The remaining Kerrville exceedance was associated with the October 2018 flood (100%). At Center Point, three of seven exceedances (42.9%) were related to the 2025 or 2018 flash floods. An additional three exceedances occurred before and during the April 2010 flood (85.7%). Five of 29 WHAT exceedances at Comfort were during the July 2025 flood, one was in October 2018, and 13 were coincident with the April 2010 flood (65.5%). Importantly, these accuracies are based on countywide flash floods (the most comparable to existing official alerts) and are thus minimum estimates only. WHAT exceedances outside of countywide events corresponded well to localized flooding at specific gages (see the Supplemental Material). For comparison, the NWS issued 87 flash flood warnings to Kerr County over the same period, only 20 of which (23%) were associated with the known catchment-wide floods of 2010, 2018, or 2025 (Figs. S1 and S3) and 23 of which (26%) may have related to localized flooding (Fig. S1).
Figure 3
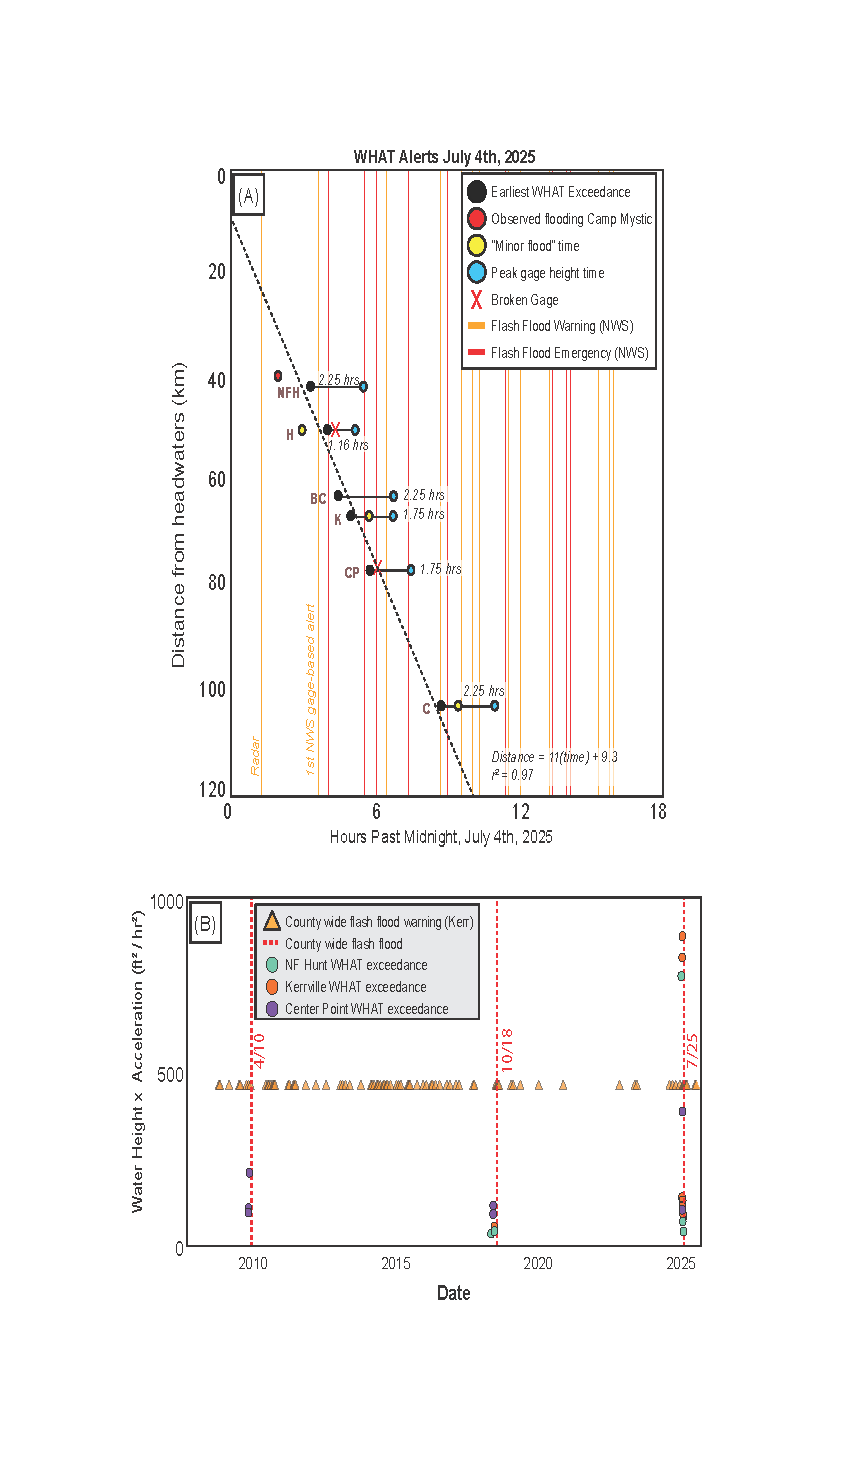
(A) WHAT alert times (black circles), minor flood stage times (yellow circles), flood peak times (blue circles). Lag between black and blue circles is possible response time at each gage based on that gage alone. Response times increase for each gage location if alerts are based on upstream gages. A 3:15 a.m. alert from the North Fork at Hunt gage would have provided 5.5 h of response time for Comfort, but an alert based on the Comfort gage would have only afforded 2.25 h of notice before the flood peak. Orange and red lines indicate NWS-issued alerts (Table S1; see text footnote 3). (B) Over the hydrologic record, two of the three significant flood events identified in Figure S1 (October 2018 and July 2025) were signaled by WHAT exceedances at North Fork at Hunt, Kerrville, and Center Point gages. At least 87 flash flood warnings were issued during this time, with 20 associated with extensive flash flooding in 2010, 2018, or 2025.
Discussion
Response Times Enabled by the WHAT
The earliest WHAT exceedance at the furthest upstream gage was at 3:15 a.m. (Fig. 1B; Fig. 2), 20 min before the first gage-based warning was issued for Kerr County (Table S1). Flood levels peaked at this gage 2.25 h after the WHAT exceedance. Downstream, the Hunt gage reached its minor flood stage at 3 a.m., one hour before the first WHAT exceedance at 4 a.m. and 63 min before the first flash flood emergency (Table S1). By 4:35 a.m., the gage had stopped recording data, and gage height peaked at 5:10 a.m., more than an hour after the WHAT exceedance. As the initial flood wave continued, the Bear Creek and Kerrville gages exceeded their WHATs at 4:30 and 5 a.m., respectively. At 5:45 a.m., 11 min after the NWS issued a flash flood emergency for Kerr County (Fig. 3A; Table S1), water reached minor flood stage at Kerrville, and flooded low-water crossings were reported (Emanuel, 2025). An alert issued between 4:30 and 5 a.m. based on exceedances at Bear Creek and Kerrville may still have provided time (between 2.25 and 1.75 h) to respond before waters surged precipitously. The first Center Point exceedance was at 5:45 a.m., shortly before the gage became nonoperational. At 7:30 a.m., the flood peaked at 39.61 ft, indicating less response time between acceleration surge and flood peak at downstream locations (1.75 versus 3.25 h, Fig. 3A). Finally, the Comfort gage exceeded its WHAT at 8:45 a.m., 45 min before reaching minor flood stage and 2.25 h before waters peaked.
Although the main surge of floodwaters had traversed Kerr County by 9:30 a.m. (Fig. 1B), an additional 13 alerts (alternating between warnings and emergencies) were issued before 4 p.m. (Fig. 3A; Table S1). These were valuable for keeping residents aware that weather and road conditions were still dangerous but could not prompt action ahead of flash flooding. While WHAT exceedances at upstream gages could provide most response time to downstream communities, all gages except Hunt (Table 1) exhibited ~45 min of lag between WHAT exceedance and minor flood gage heights due to the nature of acceleration versus gage height (Fig. 2) and 1.16–2.25 h between WHAT exceedance and peak flood levels (Fig. 3A). Further, WHAT exceedances at downstream gages (Kerrville, Center Point, Comfort) should be considered by downstream communities across county lines (Figs. 1B and 3A). Camp Mystic, upstream of Hunt on the South Fork of the Guadalupe River (Figs. 1B, 3A), began flooding around 2 a.m. (Gerberg et al., 2025). As forward models leveraging forecasted precipitation currently have limited utility at upstream locations due to a lack of temporal data for validation (Prakash et al., 2025; Lee and Hwang, 2023), neither WHATs nor conventional alerting methods can provide advance notice of flash flooding to upstream communities without additional upstream gages. To address this, interpolation between gaged watersheds, scaling of alert radii relative to WH × A magnitude, and integration of the WHAT method into regionalization techniques (Prakash et al., 2025) or global AI initiatives (Nearing et al., 2024) may be explored.
Considerations for Implementation
Gage heights along the Guadalupe River show near-zero 2nd derivatives outside of flash flood scenarios, suggesting that acceleration-based thresholds can be defined and benchmarked to inform watershed-specific alerts. With more study, the WHAT approach established here could be applied to other flood-prone basins and operationally coupled with regional emergency management to enable public response before flooding onset. To do this, the following considerations should be made:
- Gage location. Gages upstream of population centers stand to provide the greatest response times for downstream communities.
- Alert messaging and tolerance. The hydrologic record for selected gages should be examined with respect to historical flood events. Gages with appreciable WHAT exceedances not related to known flash flooding may result in over-alerting with respect to countywide flash floods (Hunt, Bear Creek, Comfort; Fig. S3), whereas gages whose WHAT exceedances correlate best with flash floods (North Fork at Hunt, Kerrville, Center Point; Fig. 3B) may be most reliable. Gage reliability may be a function of drainage organization, channel geometry, or external factors such as damming (Acharya et al., 2023) or land use changes (Fares et al., 2026).
- Thresholding events. Single-event calibration can produce gage-specific thresholds that may not capture all flood scenarios. At the Hunt gage, minor flood stage was reached at 3 a.m., one hour before the WHAT exceedance at 4 a.m. This occurred because the October 2018 WHAT (313.8 ft2/hr2) is the highest of all gages, likely reflecting localized conditions during that single calibration event. Additionally, water levels at Hunt were already elevated from precipitation earlier in the week during the October 2018 event (Fig. S2), which may have dampened the acceleration signal. Despite this limitation, the Hunt WHAT was still exceeded well before the flood peak (5:10 a.m.), and upstream gages (North Fork at Hunt at 3:15 a.m.) could have provided warning to Hunt residents.
- Alert scale. Many WHAT exceedances classified as false positives for countywide alerts actually corresponded to localized gage height increases (Fig. S1) and may represent valid hyperlocal flood signals. Bear Creek and Comfort had lower countywide accuracy (43% and 66%), but these false positives often preceded downstream flooding or represented tributary-specific events, suggesting that the WHAT framework may support both countywide and reach-specific alerting.
- Data quality and temporal resolution. Gages with 5 min data yield higher accelerations than gages with 15 min data. Missing time intervals or broken gages can similarly impact accelerations. A workflow for processing 15 min data is detailed in the Supplemental Material.
- Model-based validation. A process-based flood model (e.g., Super-Fast Inundation of Coasts, or SFINCS) could be paired with WHATs to validate the spatial propagation speed (Fig. 3A) and surge-onset timing inferred from acceleration spikes, particularly when upstream observational data are unavailable or gages fail during peak conditions.
- Community signal-to-action coupling. WHAT alerts should be operationally linked to local dissemination and rapid-response coordination workflows with stakeholders (for Kerr County, Texas, these could include the Texas Water Development Board, Texas Division of Emergency Management, Guadalupe-Blanco River Authority, and the NWS Austin/San Antonio weather forecast office) so residents receive clear, actionable warnings before a major flood surge.
References Cited
- Acharya, A., et al., 2023, Relevance of tributary inflows for driving molecular composition of dissolved organic matter (DOM) in a regulated river system: Water Research, v. 232, https://doi.org/10.1016/j.watres.2023.119975.
- Baker, M., 2025, Camp Mystic flood history: New York Times, https://www.nytimes.com/2025/07/11/us/camp-mystic-flood-history.html (accessed November 2025).
- Bosch, J.M., and Hewlett, J.D., 1982, A review of catchment experiments to determine the effect of vegetation changes on water yield and evapotranspiration: Journal of Hydrology (Amsterdam), v. 55, p. 3–23, https://doi.org/10.1016/0022-1694(82)90117-2.
- Chang, S., Wilkho, R.S., Gharaibeh, N., Sansom, G., Meyer, M., Olivera, F., and Zou, L., 2023, Environmental, climatic, and situational factors influencing the probability of fatality or injury occurrence in flash flooding: A rare event logistic regression predictive model: Natural Hazards, v. 116, https://doi.org/10.1007/s11069-023-05845-x.
- Chow, D., 2025, U.S. hit with record number of flash flood warnings: NBC News, https://www.nbcnews.com/science/science-news/us-hit-record-number-flash-flood-warnings-rcna219187 (accessed November 2025).
- Cristiano, E., ten Veldhuis, M.-C., and van de Giesen, N., 2017, Spatial and temporal variability of rainfall and their effects on hydrological response in urban areas: A review: Hydrology and Earth System Sciences, v. 21, p. 3859–3878, https://doi.org/10.5194/hess-21-3859-2017.
- Currie, K., and Henrikson, E., 2020, A look back: 2-year anniversary of 2018 Llano River flood: KXAN, https://www.kxan.com/weather/a-look-back-2-year-anniversary-of-2018-llano-river-flood/ (accessed November 2025).
- Deboeck, P.R., Montpetit, M.A., Bergeman, C.S., and Boker, S.M., 2009, Using derivative estimates to describe intraindividual variability at multiple time scales: Psychological Methods, v. 14, p. 367–386, https://doi.org/10.1037/a0016622.
- Dryden, R., Anand, M., Lehner, B., and Fluet-Chouinard, E., 2021, Do we prioritize floodplains for development and farming? Mapping global dependence and exposure to inundation: Global Environmental Change, v. 71, https://doi.org/10.1016/j.gloenvcha.2021.102370.
- Duvoisin, M., 2025, Deadly hill country flood has happened before: Express News, https://www.expressnews.com/news/article/hill-country-deadly-flood-has-happened-before-1987-20427606.php (accessed November 2025).
- Emanuel, G., 2025, Here’s a timeline of the catastrophic Texas floods: NPR, https://www.npr.org/2025/07/05/nx-s1-5457759/texas-floods-timeline (accessed November 2025).
- Fares, A., Adem, A., Awal, R., Veettil, A.V., and Rahman, A., 2026, Hydro-climatology, land-use change, and source-area controls in the Upper Guadalupe River Watershed, Texas Hill Country: 106th American Meteorological Society Annual Meeting, https://ams.confex.com/ams/106ANNUAL/meetingapp.cgi/Paper/477766.
- Garcia, J., 2018, Guadalupe River rises in Kerrville: Spectrum News 1, https://spectrumlocalnews.com/tx/san-antonio/news/2018/10/16/guadalupe-river-rises-in-kerrville (accessed November 2025).
- Gerberg, J., Gamboa, S., Chesky, M., Long, C., and Schuppe, J., 2025, How the deadliest hours of the devastating Texas floods unfolded: NBC News, https://www.nbcnews.com/news/us-news/texas-flooding-unfolded-deadly-kerrville-camp-mystic-rcna217712 (accessed November 2025).
- Guadalupe-Blanco River Authority, 2021, Staying safe: https://www.gbra.org/wp-content/uploads/2021/04/StayingSafe.pdf (accessed November 2025).
- Hawes, J.B., 2025, Some Texas officials didn’t respond to flood alerts, echoing the tragedies of Hurricane Helene: ProPublica, https://www.propublica.org/article/texas-flooding-evacuations-hurricane-helene (accessed November 2025).
- Iowa Environmental Mesonet (Iowa Mesonet), 2025, https://mesonet.agron.iastate.edu/ (accessed November 2025).
- Jensen, D., and Pederson, R., 2005, Spatial variability of rainfall: Variations within a single radar pixel: Atmospheric Research, v. 77, p. 269–277, https://doi.org/10.1016/j.atmosres.2004.10.029.
- Jonkman, S.N., Curran, A., and Bouwer, L.M., 2024, Floods have become less deadly: An analysis of global flood fatalities 1975–2022: Natural Hazards, v. 120, p. 6327–6342, https://doi.org/10.1007/s11069-024-06444-0.
- Junk, W.J., Bayley, P.B., and Sparks, R.E., 1989, The flood pulse concept in river-floodplain systems: Proceedings of the International Large River Symposium, https://www.waterboards.ca.gov/bay_delta/docs/cmnt081712/sldmwa/junketal1989.pdf.
- Kofsky, J., 2025, Flood risk in Kerr County, Texas, was no secret to officials, newly released records show: ABC News, https://abcnews.go.com/US/flood-risk-kerr-county-texas-secret-officials-newly/story?id=124426655 (accessed November 2025).
- Kumar, A., 2025, Texas identifies the 119 people killed in Kerr County floods: The Texas Tribune, August 8, 2025, https://www.texastribune.org/2025/08/08/texas-hill-country-floods-victims-names/ (accessed November 2025).
- Lee, J., and Hwang, S., 2023, Ungauged basin flood prediction using long short-term memory and unstructured social media data: Water (Basel), v. 15, no. 21, https://doi.org/10.3390/w15213818.
- McDermott, T.K.J., 2022, Global exposure to flood risk and poverty: Nature Communications, v. 13, https://doi.org/10.1038/s41467-022-30725-6.
- McManamay, R.A., 2022, Hydrology and classification of rivers for management: Encyclopedia of Inland Waters, v. 2, p. 258–275, https://doi.org/10.1016/B978-0-12-819166-8.00080-3.
- National Weather Service (NWS), 2025, Flood warning vs. watch: https://www.weather.gov/safety/flood-watch-warning (accessed November 2025).
- Nearing, G., Cohen, D., Dube, V., Gauch, M., Gilon, O., Harrigan, S., Hassidim, A., Klotz, D., Kratzert, F., Metzger, A., et al., 2024, Global prediction of extreme floods in ungauged watersheds: Nature, v. 627, p. 559–563, https://doi.org/10.1038/s41586-024-07145-1.
- Prakash, H., Pandey, K.K., and Soni, P., 2025, Peak discharge estimation for ungauged basins: A review: Journal of Water and Climate Change, v. 16, no. 11, p. 3483–3507, https://doi.org/10.2166/wcc.2025.153.
- Rogger, M., Agnoletti, M., Alaoui, A., et al., 2017, Land use change impacts on floods at the catchment scale: Challenges and opportunities for future research: Water Resources Research, v. 53, p. 5209–5219, https://doi.org/10.1002/2017WR020723.
- Saco, P.M., McDonough, K.R., Rodriguez, J.F., Rivera-Zayas, J., and Sandi, S.G., 2021, The role of soils in the regulation of hazards and extreme events: Philosophical Transactions of the Royal Society of London. Series B, Biological Sciences, v. 376, https://doi.org/10.1098/rstb.2020.0178.
- Samansiri, S., Fernando, T., and Ingirige, B., 2023, Critical failure factors of flood early warning and response systems (FEWRS): A structured literature review and interpretive structural modelling (ISM) analysis: Geosciences, v. 13, https://doi.org/10.3390/geosciences13050137.
- Swallom, M.L., Dortch, J.M., and Thigpen, J.R., 2025, Assessing the effects of anthropogenesis on Appalachian flood severity: An eastern Kentucky case study: Geomorphology, v. 482, https://doi.org/10.1016/j.geomorph.2025.109818.
- Tanaka, K., Kito, T., and Tanaka, K., 2026, When flood warnings fail: Psychological predictors of information clarity and evacuation intention: International Journal of Disaster Risk Reduction, v. 137, https://doi.org/10.1016/j.ijdrr.2026.106075.
- Tellman, B., Sullivan, J.A., Kuhn, C., Kettner, A.J., Doyle, C.S., Brakenridge, G.R., Erickson, T.A., and Slayback, D.A., 2021, Satellite imaging reveals increased proportion of population exposed to floods: Nature, v. 596, p. 80–86, https://doi.org/10.1038/s41586-021-03695-w.
- Thieken, A.H., Bubeck, P., Heidenreich, A., von Keyserlingk, J., Dillenardt, L., and Otto, A., 2023, Performance of the flood warning system in Germany in July 2021: Insights from affected residents: Natural Hazards and Earth System Sciences, v. 23, p. 973–990, https://doi.org/10.5194/nhess-23-973-2023.
- Trenberth, K.E., Dai, A., Rasmussen, R.M., and Parsons, D.B., 2003, The changing character of precipitation: Bulletin of the American Meteorological Society, v. 84, no. 9, p. 1205–1218, https://doi.org/10.1175/BAMS-84-9-1205.
- United States Geological Survey (USGS), 2025, WaterAlert: https://accounts.waterdata.usgs.gov/wateralert/ (accessed November 2025).
- Wilford, D.J., Sakals, M.E., Innes, J.L., Sidle, R.C., and Bergerud, W.A., 2004, Recognition of debris flow, debris flood and flood hazard through watershed morphometrics: Landslides, v. 1, p. 61–66, https://doi.org/10.1007/s10346-003-0002-0.
1 Supplemental Material. October 2018 thresholding results and procedures and discussion of all WHAT exceedances versus official flood alerts since 2007. Please visit https://doi.org/10.1130/GSAT.S.34693125 to access the supplemental material, and contact editing@geosociety.org with any questions.
Manuscript received 22 January 2026
Revised manuscript received 11 June 2026
Manuscript accepted 8 October 2026