
Beast Quake (Taylor’s Version): Analysis of Seismic Signals Recorded during Two Taylor Swift Concerts in Seattle, July 2023
Jacqueline Caplan-Auerbach et al.
In this article
Authors
Jacqueline Caplan-Auerbach
Geology Department, Western Washington University, Bellingham, Washington 98225, USA
Kyla Marczewski
Pacific Northwest Seismic Network, University of Washington, Seattle, Washington 98195, USA
Gavin Bullock
Pacific Northwest Seismic Network, University of Washington, Seattle, Washington 98195, USA
Abstract
Taylor Swift’s concerts at Lumen Field in Seattle, Washington, USA, on 22 and 23 July 2023 were detected by an accelerometer located proximal to the stadium. The signals were nearly identical over the two nights, consistent with a repeated setlist. Ground shaking is recorded in two frequency bands: broadband energy between 30 and 80 Hz, and harmonic low frequencies between 1 and 8 Hz. Discrete songs are clearly visible within the data, with narrow-band low-frequency signals matching the published tempo of each song. Signals recorded during the sound check contain little to no low-frequency energy, suggesting that low-frequency energy is associated with the synchronous motion of a dancing crowd. High-frequency energy is observed only during songs that include a full band, as opposed to solo acoustic performances by Swift. Video data provided by citizen scientists at the concerts allow us to correlate changes in seismic amplitude with observations of crowd motion. The synchronized motion of 72,000 fans created sustained energy that exceeded the iconic “Beast Quake” in 2011.
*caplanj@wwu.edu
CITATION: Caplan-Auerbach, J., Marczewski, K., and Bullock, G.S., 2024, Beast Quake (Taylor’s Version): Analysis of seismic signals recorded during two Taylor Swift concerts in Seattle, July 2023: GSA Today, v. 34, p. 4–10, https://doi.org/10.1130/GSATG589A.1.
© 2024 The Authors. Gold Open Access: This paper is published under the terms of the CC-BY-NC license. Printed in USA.
Manuscript received 8 November 2023. Revised manuscript received 29 January 2024. Manuscript accepted 21 February 2024. Posted 21 March 2024.
© The Geological Society of America, 2024. CC-BY-NC.
https://doi.org/10.1130/GSATG589A.1
Introduction
On 8 January 2011, in the final minutes of an NFL Wild Card Game between the Seattle Seahawks and the New Orleans Saints, Seahawks running back Marshawn Lynch broke through the Saints’ defense and scored a touchdown that sealed a victory for the Seahawks. The crowd response was captured on a seismometer deployed proximal to the stadium (then called Qwest Field, now called Lumen Field). The seismic signal became known as the “Beast Quake,” in homage to Lynch’s nickname, “Beast Mode,” and is considered to be among the most iconic moments in Seattle sports history (King, 2015).
That the Beast Quake was detected seismically is likely due to a combination of factors. Most importantly, seismic station KDK is located in close proximity to the stadium (~150 m from the stadium’s center). The subsurface geology in the area is primarily artificial fill, sands, and silt (Troost et al., 2005), which amplifies ground shaking at seismic frequencies. Some stadiums have been observed to be set into resonance by crowd behavior and to vibrate nearby buildings (Erlingsson and Bodare, 1996), which could also contribute to the activity observed on the seismometer.
On 22 and 23 July 2023, shaking from Lumen Field was once again detected on KDK, this time during two concerts by pop singer Taylor Swift. The maximum shaking during the concert exceeded that of the Beast Quake by a factor of ~2.5 (Fig. 1). While the two events are substantially different, the potential for bragging rights between Swifties and Seahawks fans caused us to wonder if, in fact, fan activity was the cause of the seismic activity recorded during the concerts, or if the ground motion was caused by stadium resonance or the sound system.
Figure 1
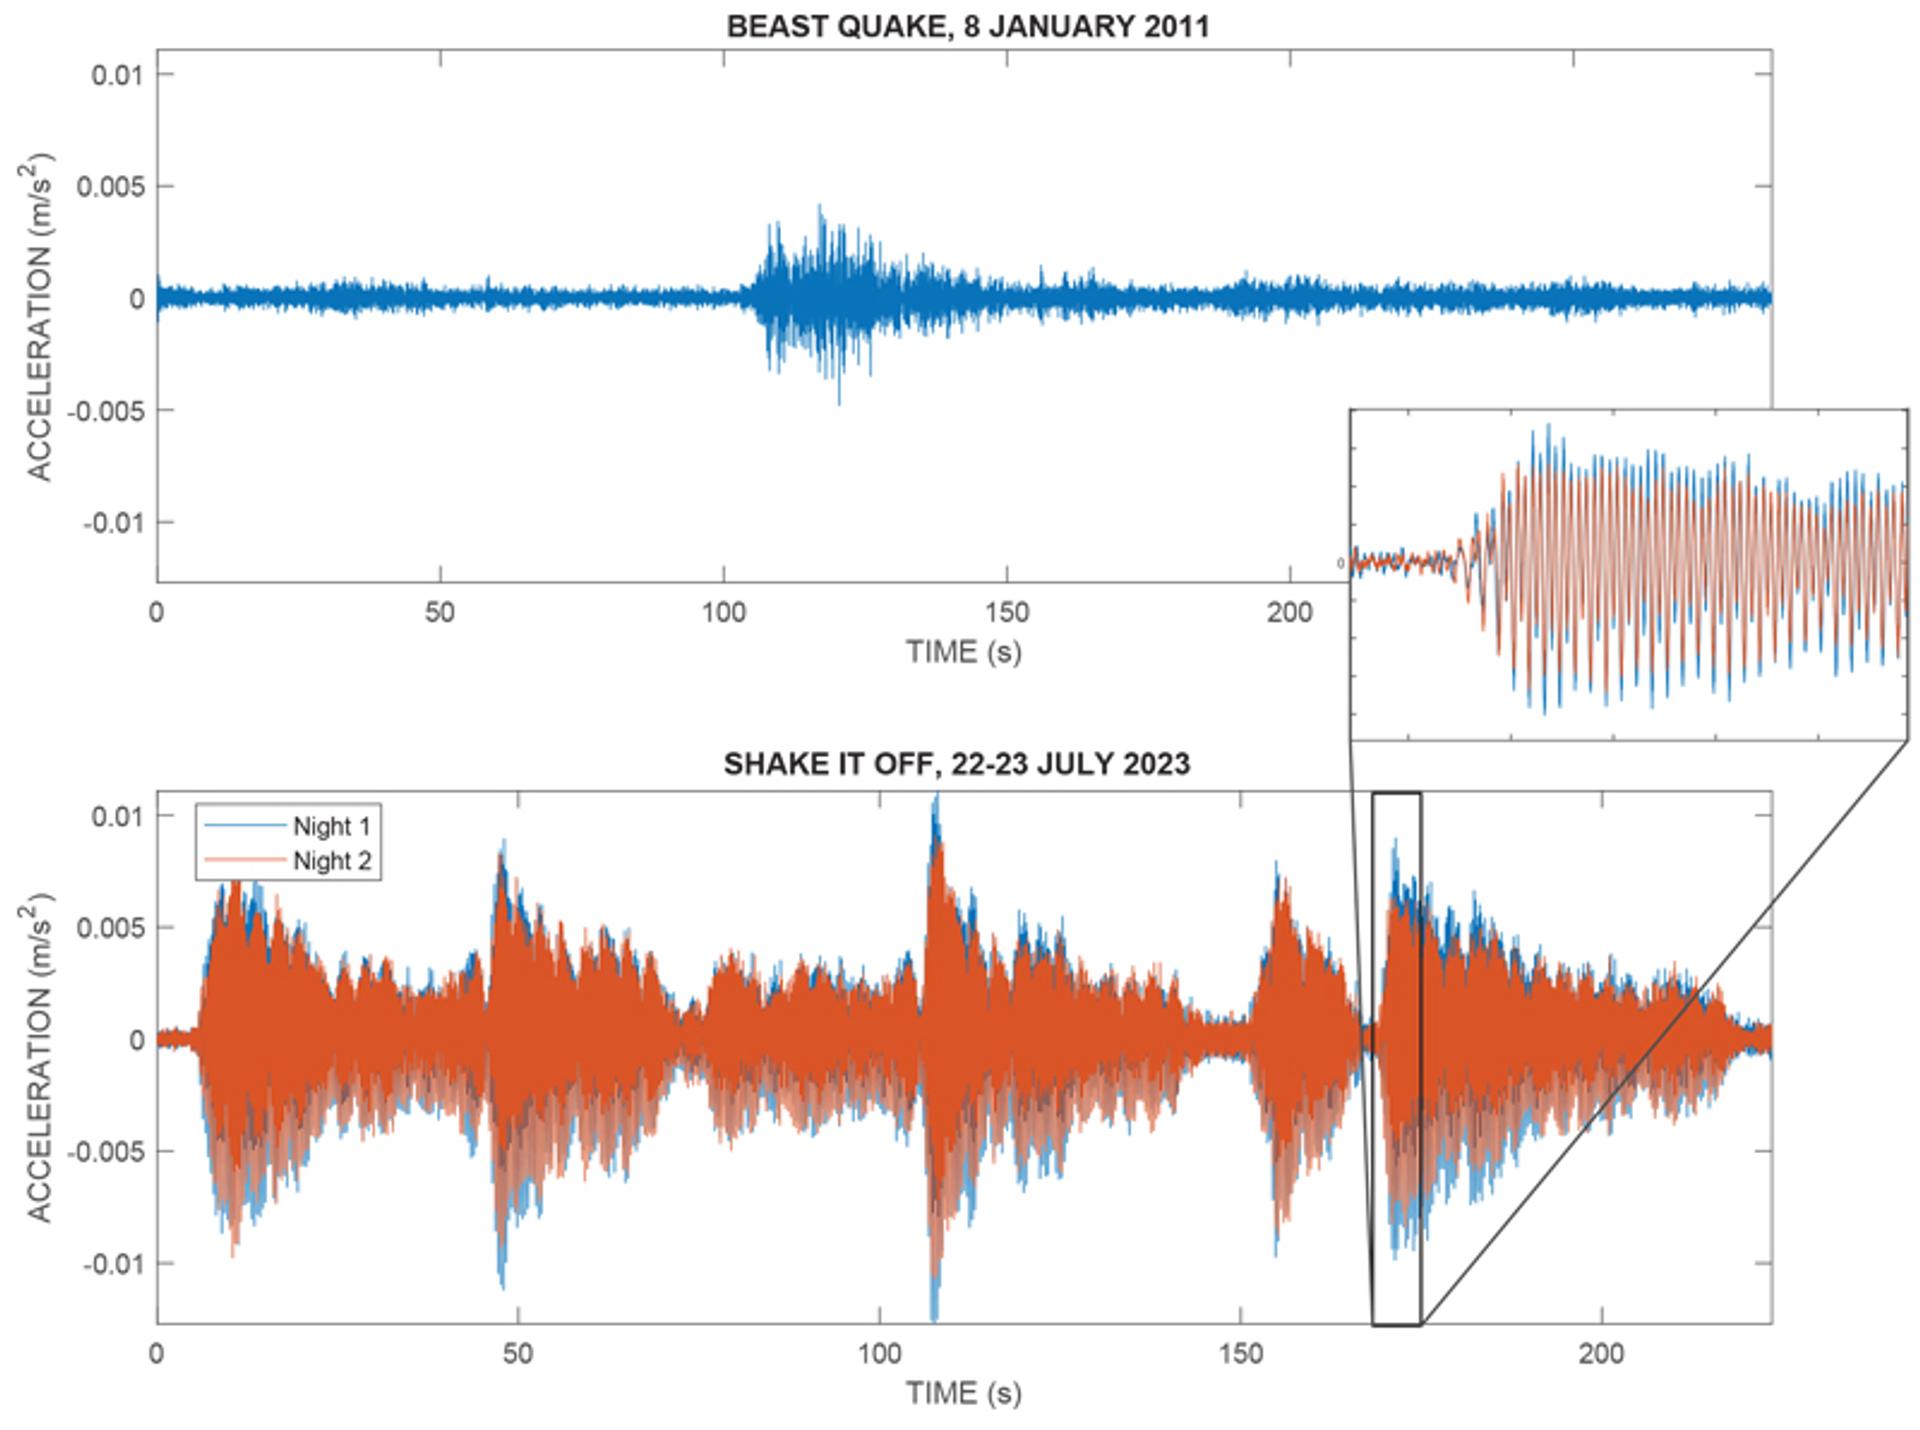
Waveforms for the 2011 Beast Quake (top panel) and a portion of the two Taylor Swift concerts (bottom panel). The Beast Quake is shorter in duration and ~2.5x weaker in amplitude. Waveforms for the song “Shake It Off” are shown for the two nights, offset in time to align the waveforms. A small portion of the song is inset as an example of the high degree of similarity. The correlation coefficient for the full song is 0.95.
In this study, we show that seismic energy detected on KDK correlates precisely between the two concerts. Crowdsourced information about the concerts allows us to link the waveform with unique songs and to show that each song’s tempo is captured in the data. We present evidence that crowd motion, including dancing, jumping, and swaying, is the primary cause of low-frequency energy recorded seismically, while higher-frequency energy relates directly to amplified music. We show that the strongest seismic signals correlate with fan behavior and conclude that, indeed, fans at the Taylor Swift concert were the chief cause of ground shaking.
Background
Anything that shakes the ground has the potential to be detected by seismometers. Observations of non-earthquake-related signals in seismic data include anthropogenic activity, animals, and surf, the primary cause of microseismic energy in seismic data (Gutenberg, 1931). Human activity is ubiquitous in urban data, with seismic signals generated by sources such as trains, cars, aircraft, and pumps (e.g., Diaz et al., 2017; Dean and Al Hasani, 2020).
Of interest are seismic signals recorded during large concerts; researchers have debated whether such signals are caused by crowd motion, stadium vibration, or the sound system. For example, Erlingsson and Bodare (1996) modeled shaking in Nya Ullevi Stadium in Sweden and suggested that crowds dancing during concerts set both the stadium and the underlying clays into resonance. Green and Bowers (2008) attributed narrow-band signals recorded during two electronic dance music (EDM) festivals to energy imparted into the ground by the loudspeakers. Yabe et al. (2022) used crowd jumping during soccer games to examine subsurface structure below the stadium.
The behavior of a crowd can generate two types of seismic noise: synchronous motion causes single-frequency shaking, while random energy generates a noisy, broadband signal (Parkhouse and Ewins, 2006). Malone et al. (2015) analyzed crowd noise at football games and showed that the original Beast Quake, caused by unsynchronized crowd motion, resulted in strong broadband shaking, whereas the same crowd jumping in time to the chant of “defense now!” was captured seismically as a narrow-band signal with a rhythm identical to that of the chant.
Other studies focus on crowd dancing and swaying. Denton (2014) examined seismic signals generated by the audience at a Madness concert and concluded that the shaking was caused by the audience dancing in time to the music. Diaz et al. (2017) examined seismic signals recorded during a Bruce Springsteen concert in Barcelona and showed that seismic spectra correlated with song tempos. Diaz et al. (2017) further suggested that synchronized crowd motion may trigger resonance in the stadium itself.
The Concerts
Taylor Swift’s Eras Tour began in the summer of 2023. Nightly attendance at the Seattle concerts averaged >70,000, which at the time set the stadium’s attendance record. Fans were allowed to enter the stadium at 4:30 p.m. PDT, and the concert was slated to begin at 6:00 p.m. PDT. The concert began with two warm-up acts: singer Gracie Adams played six songs, after which the band HAIM played six songs. Taylor Swift then played for ~3.5 h (Fig. 2A).
Figure 2
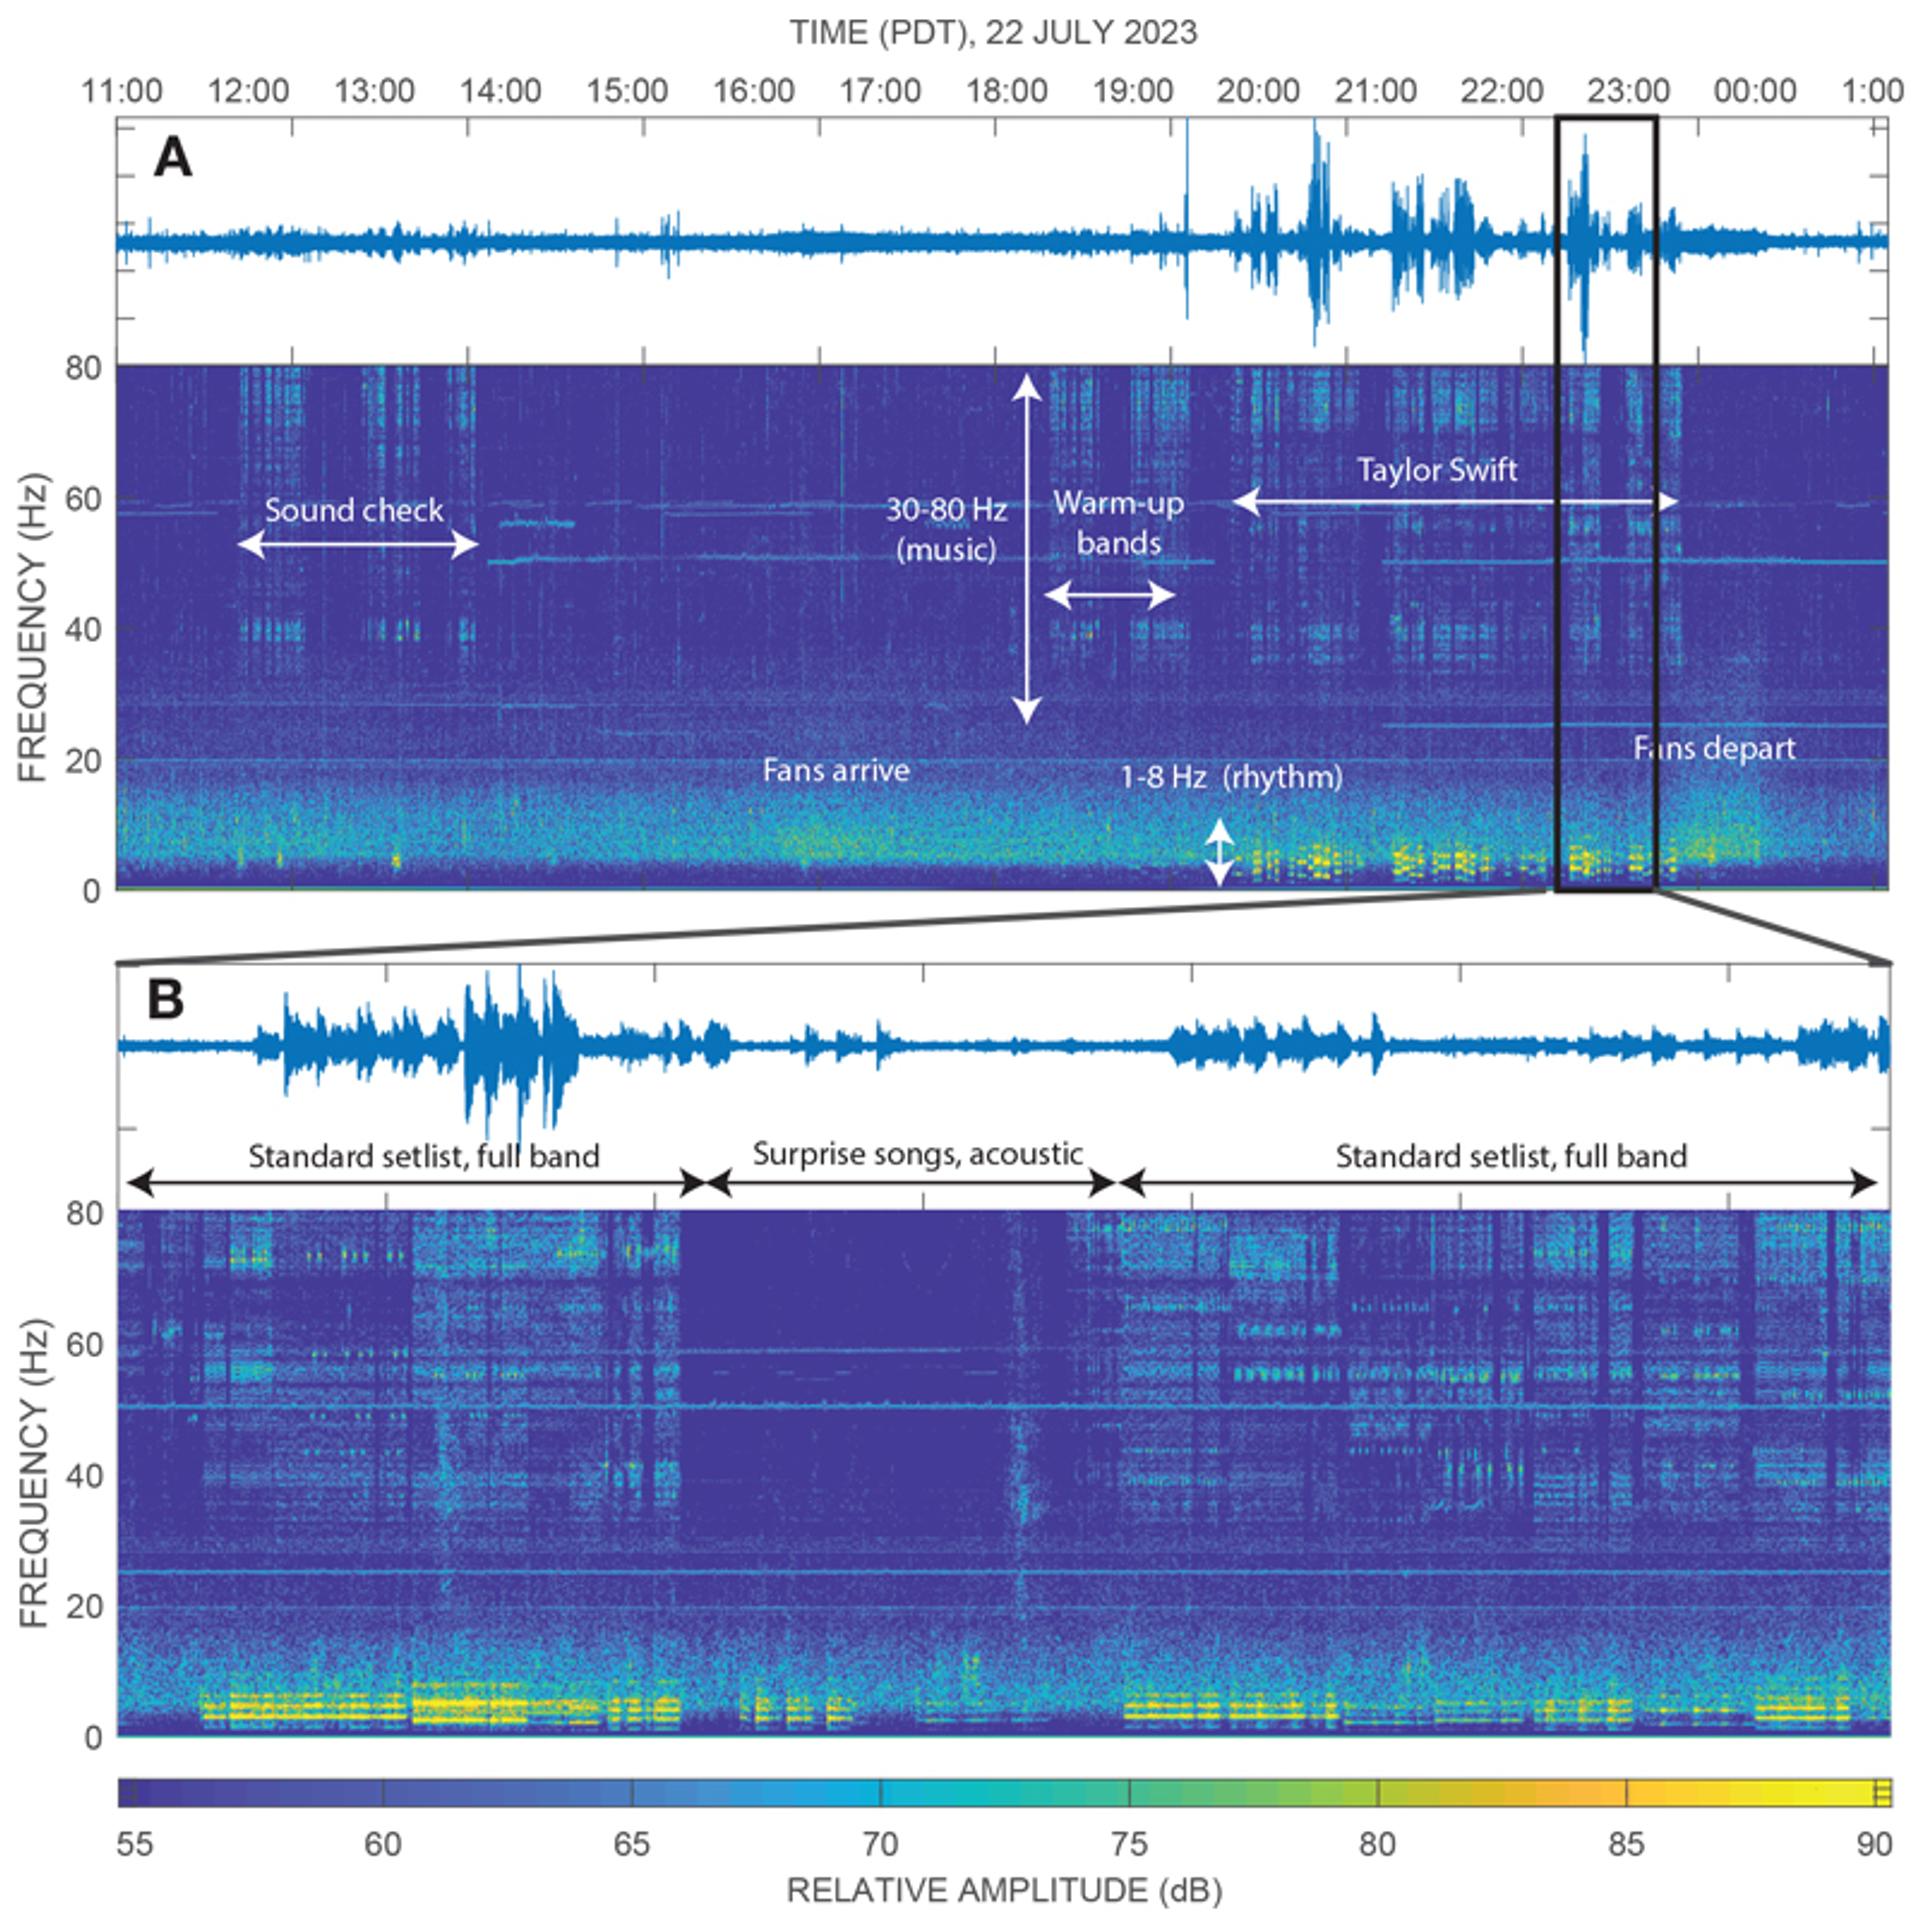
(A) Spectrogram for the 22 July 2023 concert. Energy is visible as high-frequency broadband (30–80 Hz) and low-frequency (1–8 Hz) signals. The time period includes both the sound check and the concert. Both have high-frequency broadband signals, interpreted as the music and sound system, but low-frequency signals were only recorded when fans were in attendance. The venue opened to attendees at 16:30 (4:30 p.m. PDT) and the concert ended at ~23:30 (11:30 p.m. PDT). We attribute the diffuse low-frequency signals at these times to the arrival and departure of the crowd. (B) Spectrogram for ~1 h of the 22 July concert, including songs from the standard setlist and the two “surprise songs.” Songs with 30–80 Hz signals were performed by the full band, while surprise songs included only Taylor Swift on guitar (song 1) and piano (song 2). Patterns in the high-frequency broadband signal vary over ~3–5 min time periods, consistent with the typical length of Taylor Swift’s songs.
As implied by the tour title, the setlist was broken into segments, or “eras,” each relating to a musical period in the artist’s history. The character of the music changed throughout the eras; some eras consisted of energetic and upbeat numbers that inspired more dancing, and others had a slower beat and more subdued nature. Other forms of entertainment, including videos, choreographed dancing, and changes in set design, accompanied each of the eras as well. Sets and costumes were changed between eras, resulting in times in which sound production was greatly reduced.
The setlist for all concerts in the tour was nearly identical, with both the order and choreography of songs scripted. Each concert, however, included two “surprise songs,” which were different on the two nights at Lumen Field. This allowed us to compare songs that were repeated over the two nights with songs that were not.
Stadium
Lumen Field is reputed to be among the loudest stadiums in the National Football League; during a 2013 football game, fans broke a Guinness World Record for sound volume (Associated Press, 2013). The stadium is located on the site of the former Kingdome, destroyed by controlled demolition in 2000. Seismic analysis of that implosion, as well as drill holes in the region, reveals that the stadium is underlain by thick alluvial sediments, including sands and muds (Brocher et al., 1999; Troost et al., 2005). The stadium’s capacity is ~69,000 for events in which spectators are restricted to permanent seating but can be increased if attendees are permitted on the field. The crowd at the Taylor Swift concerts was estimated to be ~72,000 on each of the two nights.
Citizen Science
Taylor Swift has a large number of dedicated fans known as “Swifties.” When a local Seattle news station reported that the concert had been recorded seismically, dozens of Swifties reached out to the lead author. We created a Google Drive to which Swifties could upload concert videos and log song start times and personal observations of the concerts. In total we received ~80 videos and dozens of comments and observations (Supplemental Table S11). Time stamps on videos and photos allowed us to confirm song and event timing. The second author attended the second concert.
-------
1 Supplemental Material. Spreadsheet showing data from the two Taylor Swift concerts, including set lists, song rhythms, and crowdsourced observations of the concerts. Please visit https://doi.org/10.1130/GSAT.S.25431844 to access the supplemental material, and contact editing@geosociety.org with any questions.
We received videos from attendees seated in a variety of locations in the stadium. Videos taken from high in the stands allowed us to observe crowd behavior across the field, and images from near the stage provided us with a view of the two bands (located on either side of the main stage). Some Swifties sent videos of the substantial crowd located outside of the stadium, and we were able to use visible landmarks to identify their location.
Seismic Data
Seismograms were recorded during the concerts on station UW.KDK, located ~150 m due west of Lumen Field. KDK is a three-component TITAN accelerometer, with flat response at frequencies < ~30 Hz. Data from station KDK were downloaded from the EarthScope Data Management Center and plotted in both the time and frequency domains. We selected a time period for analysis that spanned the expected time of the concert, plus several hours prior to the venue opening to capture sound checks and several hours after the concert was expected to end.
Waveforms for the two concerts show hours of regular, high-amplitude pulses (Fig. 2A). These can broadly be separated into three segments. The first significant period of increased signal strength lasts 23 min, the second lasts 30 min, and the final sequence lasts ~3.5 h. Each of these periods is composed of shorter-duration (3–6 min) bursts, separated by short periods of quiescence (Fig. 2B). We propose that the first two periods represent performances by the opening acts, and the third represents the headline event. The duration of the shorter bursts is consistent with the length of many pop songs.
Signals generated by concerts can be studied more thoroughly by examining the frequencies at which the ground shook. To do this, we calculated a spectrogram (Fig. 2), which uses color to show the strength of ground shaking at high (30–80 Hz) and low (<10 Hz) frequencies. We observed that signals in the high-frequency band include a variety of patterns; some have short pulses at narrow frequencies, while others are more smoothly broadband (Fig. 2B). In contrast, the low frequencies are extremely narrow-band, and they exhibit harmonics (integer multiples of a base frequency) at frequencies that vary between songs (Figs. 2B and 3).
Figure 3
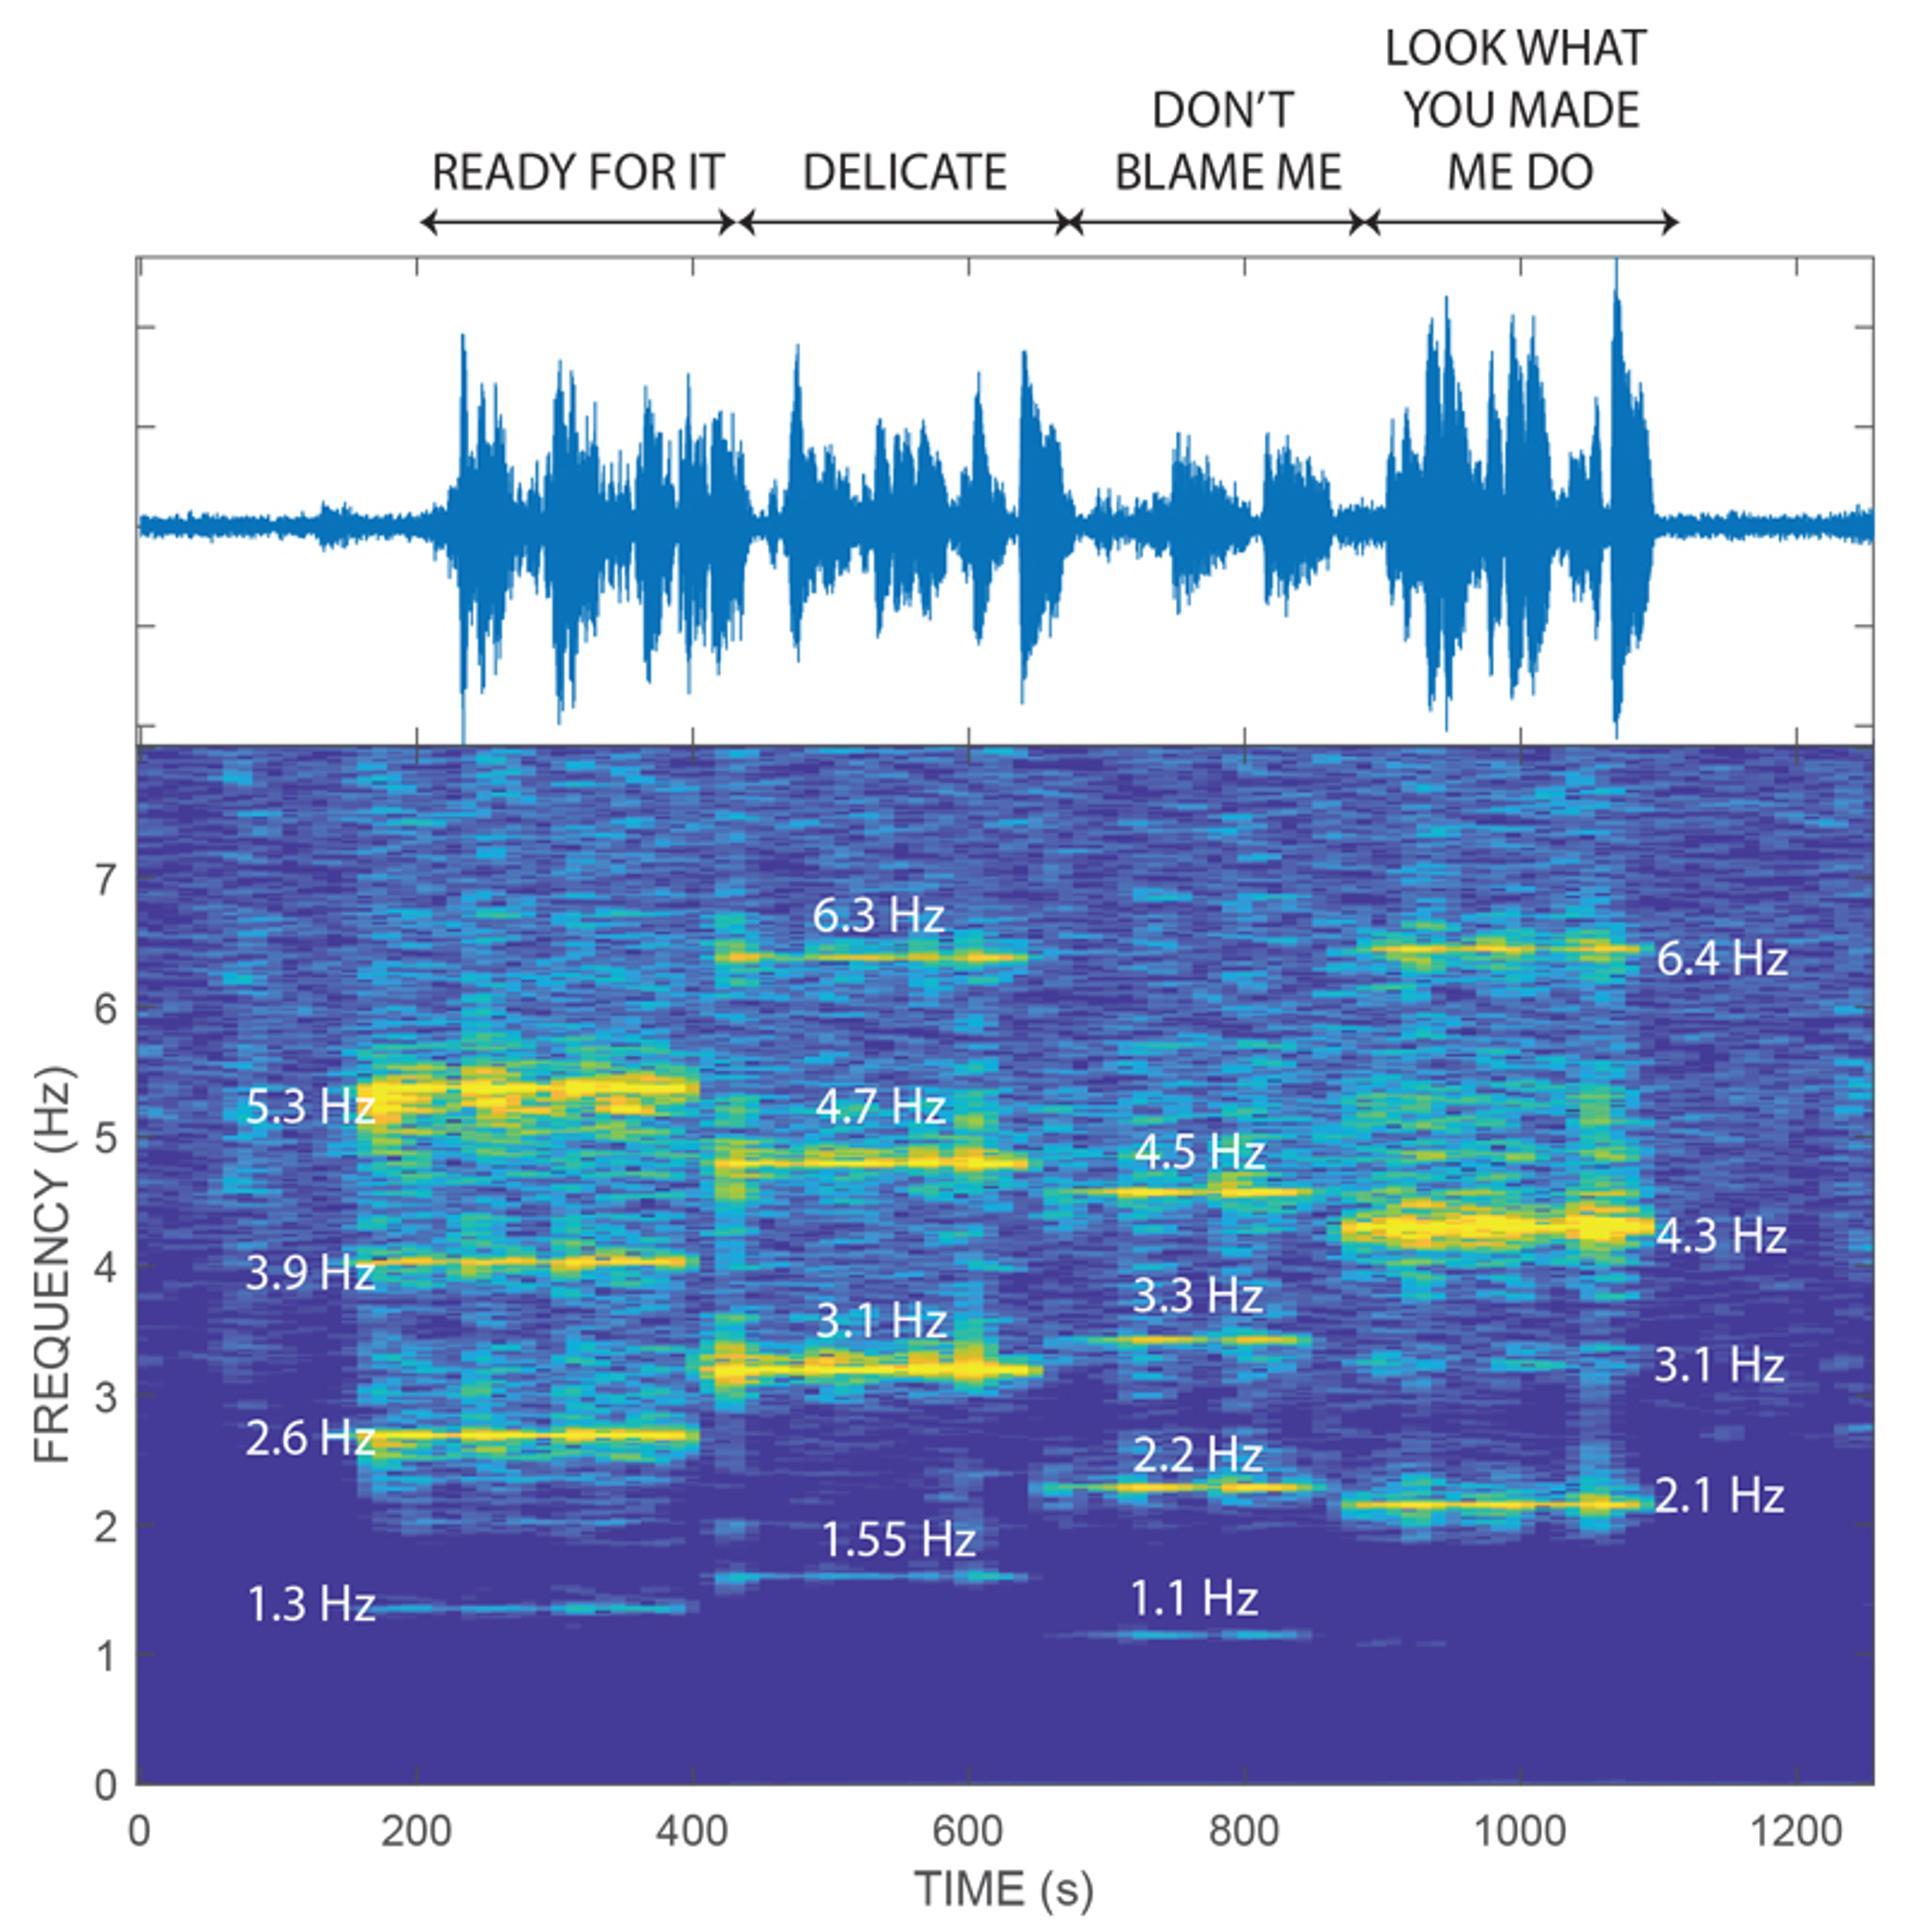
Close-up of the low-frequency seismic signals. Frequencies recorded during each song are consistent with the published beats per minute (BPM) of each song, with overtones. Colors as in Figure 2.
Two prolonged diffuse low-frequency (−5–20 Hz) signals are visible in the seismic record, beginning at ~4:30 p.m. and ~11:30 p.m. (Fig. 2A). The venue was opened to the public at 4:30 p.m., and both seismic and video data indicate that the concert ended at ~11:30 p.m. We attribute these signals to fans arriving and departing, either by foot or vehicle.
Even by sight, it is apparent that data recorded over the two nights are highly similar (Fig. 1), consistent with seismic energy generated during a repeated setlist. Cross-correlation of five hours of data between the two nights reveals a maximum correlation when the data are offset by 26 min; subsequent conversations with concert attendees confirmed that the second night of the concert was delayed by an estimated half hour. This provides additional evidence that the seismic signals were generated during the two concerts.
To test that the waveforms represented a predictable setlist played on both nights, we cross-correlated signals from the shorter-duration pulses (interpreted as, and hereafter referred to as, songs). Correlations of a song waveform over both nights were generally high (>0.75), with some exceeding 0.95 (Fig. 1).
At each concert of the Eras Tour, Taylor Swift played two “surprise songs” (Fig. 2A). These differed each night, and thus presented an excellent opportunity to test concert correlations. Indeed, the surprise songs represented the only part of the concert that was not highly similar, with a maximum correlation value of 0.03. Because the two nights’ surprise songs differed in length, the last eras of the concerts were also offset relative to one another.
Song Identification
That the short-duration pulses were in fact different songs was confirmed by (A) signal duration; (B) song rhythm; and (C) sonification of the seismic signal (Marczewski, 2023). Concert setlists were published online (e.g., Setlist.fm, 2023) and confirmed by videos submitted by attendees.
To first order, waveforms were correlated with songs by comparing their onset times with concert videos sent in by attendees. Most videos shared by Swifties were time-stamped only to the minute, which resulted in some uncertainty in the precise song start times. In many cases, a clear increase in amplitude was visible in the time series near the approximated start time, but in other cases, the onset time was less certain. We also compared song durations to published versions, but some songs were performed with extended intros or shortened for the concert.
For many songs, the seismic data have distinct, narrow-band low-frequency (1–8 Hz) signals with clear harmonics (Fig. 3). The spectral content of these signals is well below what would be expected of music, but precisely matches the rhythms of specific songs. Figure 3 shows that the fundamental frequency, or first harmonic, of each song correlates with the published rhythm of the song. For example, “Ready for It” (Fig. 3) has a published rhythm of 160 beats per minute (BPM), or 2.67 beats per second (Hz). The next three songs exhibit strong shaking at 1.6 Hz (96 BPM), 2.2 Hz (132 BPM), and 2.1 Hz (126 BPM), consistent with published values for “Delicate” (95 BPM), “Don’t Blame Me” (136 BPM), and “Look What You Made Me Do” (128 BPM).
All the low-frequency signals exhibit at least one harmonic. It is possible that part of the audience moved with a primary rhythm, whereas others moved in double-time. Studies have shown that crowds jumping as a group are most likely to bounce at frequencies between 1 and 2.3 Hz (Ginty et al., 2001). If a song has a tempo significantly outside of this range, the audience may be most comfortable moving at twice or half of the song’s primary rhythm.
It is most likely, however, that the harmonics result from a Dirac comb effect, in which regularly spaced pulses exhibit a comb-shaped power spectrum. This effect has been invoked for natural signals, such as regularly spaced earthquakes (Dmitrieva et al., 2013; Hotovec et al., 2013) and ocean swell (Aster et al., 2021). Diaz et al. (2017) invoked the same process for harmonic signals recorded during the Bruce Springsteen concert in Barcelona, Spain. It is unlikely that the crowd moved at frequencies much higher than 3 Hz, lending support to a model in which the harmonics are a consequence of the Fourier transform rather than audience motion.
Data Interpretation
Seismic amplitudes vary over the course of a given song, and crowd-sourced video and observational data confirm that amplitudes vary between verses, choruses, and bridges. In Figure 4, we present low-frequency (1–8 Hz) waveform data for the song “Love Story.” Text labels along the top denote progression from the verse to the chorus, and to the instrumental sections of the song, with representative lyrics. Lower text labels describe observations from video data of crowd motion and singer/crowd energy levels. The data show a strong correlation between song structure, crowd activity, and amplitude of ground shaking. Video data show that during the chorus (“Romeo take/save me…”) the audience begins to jump synchronously; these periods correspond to sharp increases in ground acceleration at KDK (Fig. 4). Further, seismic amplitudes remain low at the end of chorus 3, while video data show an audible increase in the energy and amplitude of the drums. This provides strong evidence that changes in seismic amplitude are associated with crowd behavior rather than the music or sound system.
Figure 4
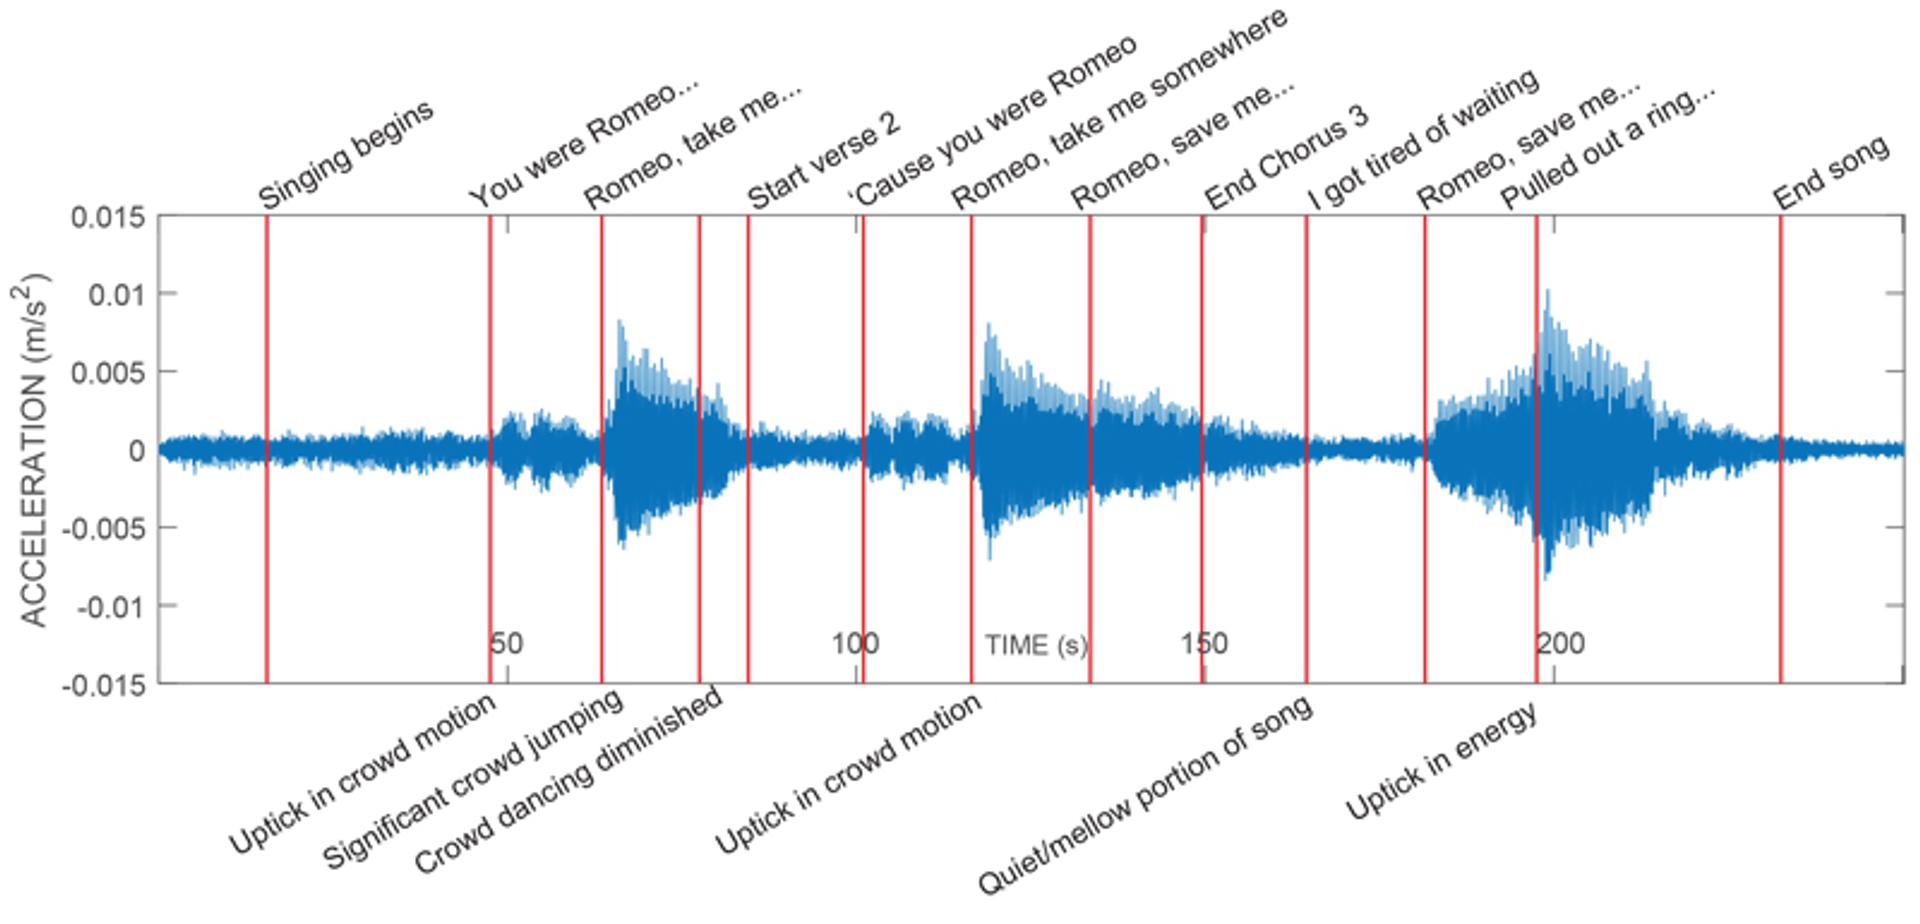
Waveform for the song “Love Story.” Vertical lines and text comments show parts of the song (top) and video-captured changes in crowd behavior (bottom). Highest amplitudes correlate with highest-energy crowd motion.
We further examined the contribution of crowd behavior to low-frequency seismic amplitudes by considering the sound check, when the band was playing but the crowd was absent. Assuming that we can identify songs by their seismic character, there were two sound checks prior to the 22 July concert: one at ~5:25 p.m. PDT on 21 July, and one at about noon PDT on 22 July (Fig. 2A). A similar signal appears in the seismic record at 1:15 p.m. PDT on 23 July, several hours before the second concert.
Both the presumed sound-check data and concerts exhibit minutes-long bursts of 30–80 Hz energy (Fig. 2B), but only the songs played during the concerts are also associated with the low-frequency harmonic signals. Although we were unable to find a setlist for the sound checks, cross-correlation of sound-check songs with the broader concert allowed us to identify two songs. The first was played by the warm-up band HAIM and had no low-frequency signals; the second appears to be a portion of the Taylor Swift song “The Man.” Only the version of “The Man” played when fans were in attendance includes the harmonic low frequencies. This provides additional support for our contention that these signals were generated by crowd activity.
The two “surprise songs” played at each concert were distinct from the rest of the setlist in that they were different each night, and Taylor Swift introduced them by saying, “Welcome to the acoustic section of the evening.” During most other songs the singer was accompanied by an amplified band, but the surprise songs were performed solo, on guitar or piano. The different character of these songs is evidenced in spectrograms—the surprise songs contain significant low-frequency energy, but no 30–80 Hz shaking (Fig. 2B). The presence of low-frequency energy in the absence of drums or other low-frequency instruments (e.g., bass guitar) again supports audience motion as its source. Other periods of the concert lack high-frequency energy, but video data confirm that these periods involve Taylor Swift either talking to the audience or playing solo. These observations suggest that the high-frequency signals are specifically associated with amplified music.
Beast Quake (Taylor’s Version)
Other than noting that the maximum amplitude of shaking was ~2.5× larger during the Taylor Swift concert, there is no simple means by which to compare it to the 2011 Beast Quake. Because stadium events are distinctly different from earthquakes in terms of duration, depth, and source process, traditional magnitude calculations are not meaningful. Per-song magnitudes of −0.5–0.85 were calculated by Tepp et al. (2024) for the Taylor Swift concerts in Los Angeles, California, USA, but these cannot easily be extended to the 2011 event. The original Beast Quake represented <1 min of ground shaking caused by an enthusiastic but randomly moving crowd of ~66,000 people. In contrast, the Eras Tour concerts lasted ~3.5 h and had significantly higher attendance. Further, thousands were on the field for the concert, where their energy could couple directly into the ground, whereas Seahawks fans were mostly confined to the stands. Most importantly, the motion of the Swifties was synchronous, as the crowd jumped and swayed to the beat of the music. This caused constructive interference and amplification of seismic energy at frequencies identical to the beat of the music. Studies of vibrations induced by crowd behavior show that synchronized motion such as jumping or swaying generates energy that is proportional to crowd size, whereas random motion scales with the square root of crowd size (Parkhouse and Ewins, 2006). The larger signals recorded during the concert are likely a function of the type of motion rather than the relative enthusiasm of the fan base.
If credit for the seismic signal is to be given to the fans, we must rule out the contribution to ground shaking from other sources. Studies of seismic data recorded in association with other stadium events have suggested shaking may reflect resonance of the stadium itself and/or the subsurface sediments (Erlingsson and Bodare, 1996). Our data show no common frequencies observed throughout the concert, which might be expected of resonance, although we cannot rule out contributions from nonresonant stadium shaking induced by the crowd. Green and Bowers (2008) stated that seismic signals recorded during an electronic music festival were caused by the sound system coupling into the ground. They show that, like the Taylor Swift concerts, the spectral frequencies are similar to the music tempo. While sound-system coupling may be a contributor to the signals presented here, the lack of low-frequency energy recorded during empty-stadium sound checks strongly suggests that the primary source of low-frequency energy was crowd motion—a win for the Swifties.
Conclusions
Using seismic data as a window into crowd behavior can provide more than just bragging rights for fans. The relative contributions of sound system, stadium resonance, and crowd behavior have been debated in the literature, and our results show that at Lumen Field the seismic signal was dominated by crowd behavior. That low- and high-frequency signals stem from different sources had not previously been described for concert-induced shaking. Constructive interference generated by synchronized crowd motion has the potential to shake the stadium at higher amplitude than stochastic crowd behavior, which could have implications for seismic engineering. But perhaps the most important outcome of this study is the enthusiasm for science exhibited by Swifties as they volunteered their observations and videos. Concert seismology proved to be an excellent opportunity to engage the public in science and introduce them to a field of science of which they may not have previously been aware. Ultimately, the Beast Quake (Taylor’s Version) may have inspired a new generation both musically and scientifically.
Acknowledgments
The authors express our deep gratitude to the Swifties for generously sharing their observations and data. We are grateful to G. Tepp, I. Stubailo, M. Kohler, O. Lamb, A. Kafka, and an anonymous reviewer for their advice and thoughtful reviews. The facilities of EarthScope Consortium were used to access waveforms and related metadata from the UW seismic network (University of Washington, 1963). These services are funded through the Seismological Facility for the Advancement of Geoscience (SAGE) Award of the National Science Foundation under Cooperative Support Agreement EAR-1851048.
References
- Associated Press, 2013, Seattle Seahawks fans set stadium noise record Sunday, Fox Sports, https://www.foxnews.com/sports/seattle-seahawks-fans-set-stadium-noise-record-sunday (accessed August 2023).
- Aster, R.C., Lipovsky, B.P., Cole, H.M., Bromirski, P.D., Gerstoft, P., Nyblade, A., Wiens, D.A., and Stephen, R., 2021, Swell‐triggered seismicity at the near‐front damage zone of the Ross Ice Shelf: Seismological Research Letters, v. 92, no. 5, p. 2768–2792, https://doi.org/10.1785/0220200478.
- Brocher, T.M., et al., 1999, Wide-angle seismic recordings from the 1998 seismic hazards investigation of Puget Sound (SHIPS), western Washington and British Columbia: U.S. Geological Survey Open-File Report, v. 99, no. 314, 110 p., https://doi.org/10.3133/ofr99314.
- Dean, T., and Al Hasani, M., 2020, Seismic noise in an urban environment: The Leading Edge, v. 39, no. 9, p. 639–645, https://doi.org/10.1190/tle39090639.1.
- Denton, P., 2014, One step beyond: Astronomy & Geophysics, v. 55, no. 5, p. 5.30–5.31, https://doi.org/10.1093/astrogeo/atu217.
- Díaz, J., Ruiz, M., Sánchez-Pastor, P.S., and Romero, P., 2017, Urban seismology: On the origin of earth vibrations within a city: Scientific Reports, v. 7, p. 15, 296, https://doi.org/10.1038/s41598-017-15499-y.
- Dmitrieva, K., Hotovec-Ellis, A.J., Prejean, S., and Dunham, E.M., 2013, Frictional-faulting model for harmonic tremor before Redoubt Volcano eruptions: Nature Geoscience, v. 6, no. 8, p. 652–656, https://doi.org/10.1038/ngeo1879.
- Erlingsson, S., and Bodare, A., 1996, Live load induced vibrations in Ullevi Stadium—Dynamic dynamic soil analysis: Soil Dynamics and Earthquake Engineering, v. 15, no. 3, p. 171–188, https://doi.org/10.1016/0267-7261(95)00041-0.
- Ginty, D., Derwent, J.M., and Ji, T., 2001, The frequency ranges of dance-type loads: Structural Engineering, v. 79, no. 6, p. 27–31.
- Green, D.N., and Bowers, D., 2008, Seismic raves: Tremor observations from an electronic dance music festival: Seismological Research Letters, v. 79, no. 4, p. 546–553, https://doi.org/10.1785/gssrl.79.4.546.
- Gutenberg, B., 1931, Microseisms in North America: Bulletin of the Seismological Society of America, v. 21, no. 1, p. 1–24, https://doi.org/10.1785/BSSA0210010001.
- Hotovec, A.J., Prejean, S.G., Vidale, J.E., and Gomberg, J., 2013, Strongly gliding harmonic tremor during the 2009 eruption of Redoubt Volcano: Journal of Volcanology and Geothermal Research, v. 259, p. 89–99, https://doi.org/10.1016/j.jvolgeores.2012.01.001.
- King, M., 2015, The 10 Greatest Seattle Sports Moments, Bleacher Report, https://bleacherreport.com/articles/2587182-the-10-greatest-seattle-sports-moments (accessed August 2023).
- Malone, S., Hall, K., Simmons, L., and Vidale, J., 2015, How to recognize a “beast quake” and a “dance quake”: Seismological Research Letters, v. 86, no. 3, p. 1006–1008, https://doi.org/10.1785/0220150053.
- Marczewski, K., 2023, Beast Quake (Taylor’s Version) (From The Vault): https://pnsn.org/blog/2023/08/15/beast-quake-taylor-s-version-from-the-vault (accessed February 2024).
- Parkhouse, J.G., and Ewins, D.J., 2006, Crowd-induced rhythmic loading: Proceedings of the Institution of Civil Engineers: Structures and Buildings, v. 159, no. 5, p. 247–259, https://doi.org/10.1680/stbu.2006.159.5.247.
- Setlist.fm, 2023, Taylor Swift Setlist at Lumen Field, Seattle, WA, USA: https://www.setlist.fm/setlist/taylor-swift/2023/lumen-field-seattle-wa-3ba4a0dc.html (accessed August 2023).
- Tepp, G., et al., 2024, Shake to the beat: Exploring the seismic signals and stadium response of concerts and music fans: Seismological Research Letters, https://doi.org/10.1785/0220230385.
- Troost, K.G., Booth, D.B., Wisher, A.P., and Shimel, S.A., 2005, The geologic map of Seattle—A progress report: U.S. Geological Survey Open-File Report 2005-1252, https://pubs.usgs.gov/of/2005/1252/.
- University of Washington, 1963, Pacific Northwest Seismic Network [Data set]: International Federation of Digital Seismograph Networks, https://doi.org/10.7914/SN/UW.
- Yabe, S., Nishida, K., and Sakai, S., 2022, Earth-shaking J. LEAGUE supporters: Earth, Planets and Space, v. 74, no. 123, https://doi.org/10.1186/s40623-022-01686-3.
