
Metamorphic Core Complex Dichotomy in the North American Cordillera Explained by Buoyant Upwelling in Variably Thick Crust
Andrew V. Zuza and Wenrong Cao
In this article
Introduction
Vertical material advection in Earth’s lithosphere impacts heat transport, rheology, crustal differentiation, and planetary cooling (Gans, 1989; Rey et al., 2009; Moore and Webb, 2013; Whitney et al., 2004, 2013). The formation of continental metamorphic core complexes (MCCs) is one such process, where mid-lower crust rocks are exhumed as arched domal structures with spatially coexisting ductile shear zones and brittle faults (Coney, 1980; Yin, 2004; Whitney et al., 2013; Platt et al., 2015) (Fig. 1).
Figure 1
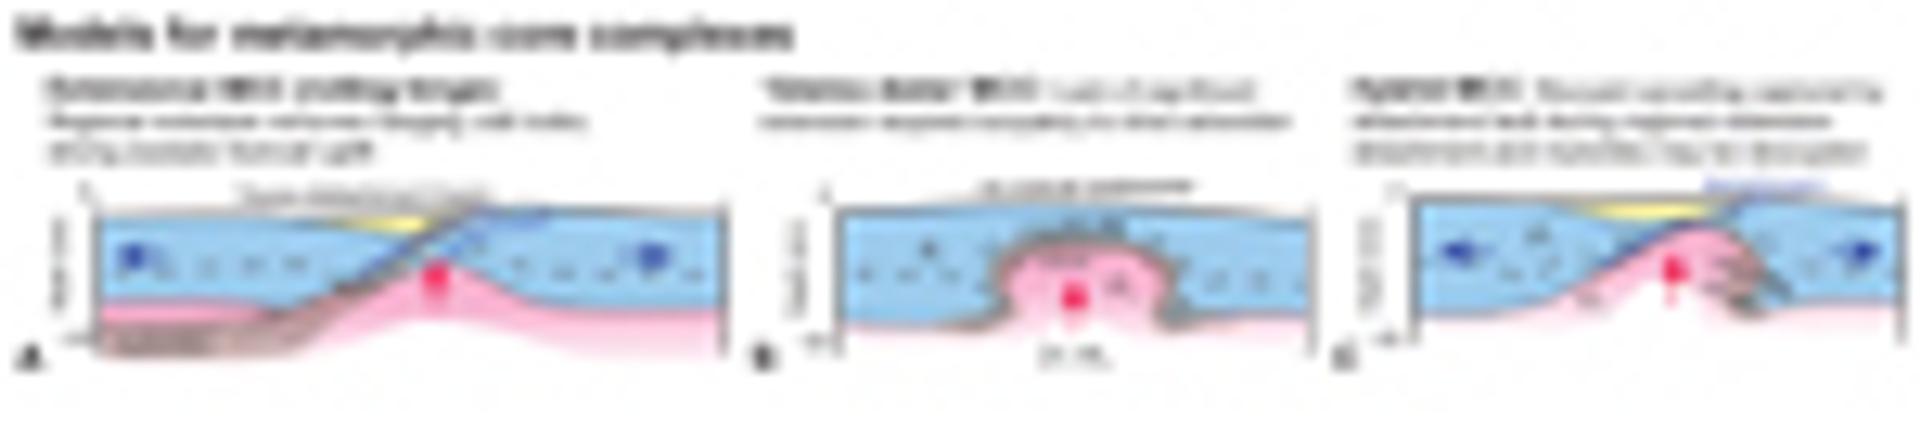
Spectrum of metamorphic core complex models: ρ1 and ρ2 are the density of the upper and lower crust, respectively. MCC—metamorphic core complex.
MCCs comprise a belt stretching across the North American Cordillera (Fig. 2A) (Coney, 1980). They may have formed from the thermally induced buoyant ascent of migmatitic or plutonic cores as gneiss domes (e.g., Eskola, 1949; Whitney et al., 2004) (Fig. 1B) or during regional crustal extension via detachment faulting coupled with isostatic exhumation of footwall rocks (e.g., Wernicke, 1981; Wernicke and Axen, 1988) (Fig. 1A). Here we show how this long-held discussion reflects a distinct dichotomy between MCCs formed in the hinterland of the Sevier thrust front versus those in its foreland (Fig. 2A). Using compiled records of magmatism and MCC evolution, plate reconstructions, and numerical models, we argue that MCCs originally initiated as buoyant domes whose formation and spacing was controlled by the thermal state and thickness of the crust. Farallon slab dynamics and plate-boundary conditions influenced the timing of doming and contributed to their final exhumation via detachment faults. Our study highlights how thermal structure controls mass and heat transport across the lithosphere.
Figure 2
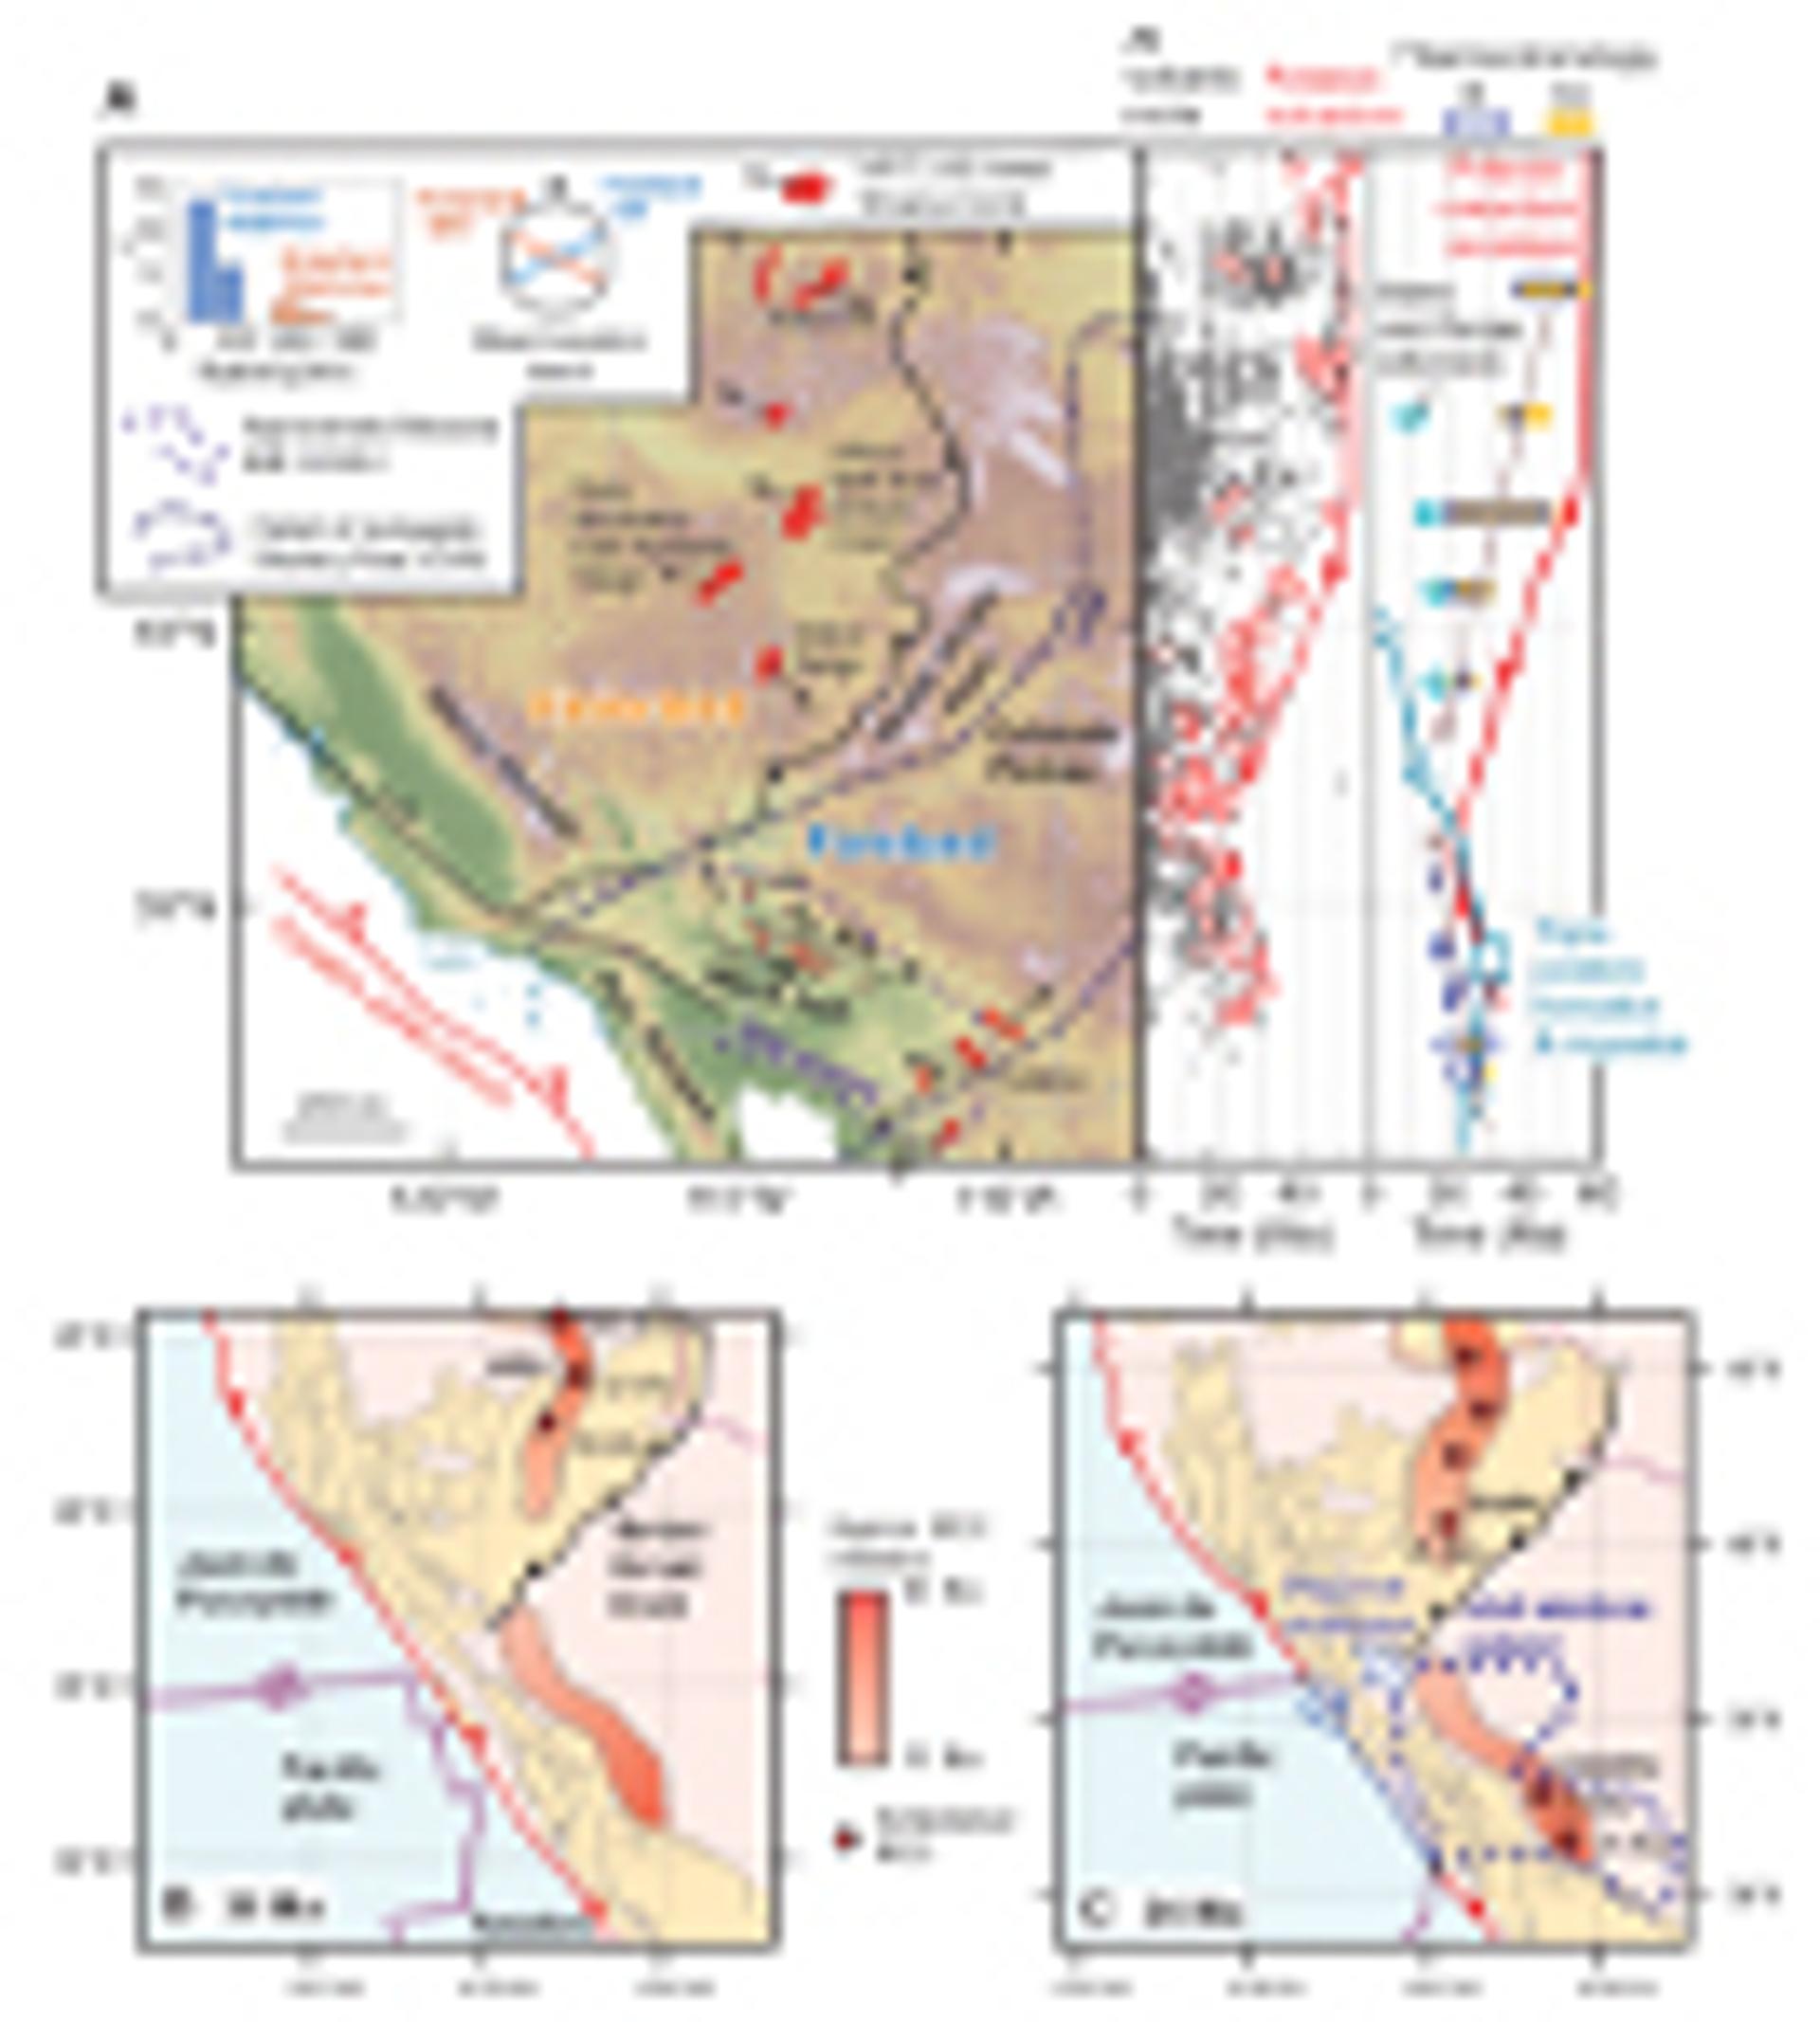
(A) Metamorphic core complexes (MCCs) in the hinterland and foreland of the Sevier thrust front in the North American Cordillera. Right graph shows NAVDAT volcanic (black) and potassic rocks (red), MCC and regional extension timing constraints (Supplemental Material [see text footnote 1]), and reconstructed triple-junction formation (square) and migration (arrows). (B, C) Plate reconstructions of Oligocene western North America (Clennett et al., 2020). Hinterland MCCs initiate prior to triple-junction formation and migration, decoupled from these tectonic events, whereas the foreland MCCs develop during triple-junction migration and slab-window development. ARG—Albion–Raft River–Grouse Creek; bt—biotite; ms—muscovite.
Metamorphic Core Complexes of the North American Cordillera
The North American Cordillera involved Mesozoic east-dipping oceanic subduction, arc magmatism, and retro-arc thrusting (e.g., Yonkee and Weil, 2015). The Late Cretaceous Sevier thrust front stretches north across western North America, defining the eastern limit of a thickened orogenic plateau (i.e., the Nevadaplano; DeCelles, 2004). Subduction of the conjugate Shatsky Rise (CSR) ca. 80–40 Ma caused the subducting Farallon slab to flatten eastward, which resulted in underplating of forearc sediments and the cessation of magmatism (e.g., Livaccari et al., 1981; Copeland et al., 2017; Chapman et al., 2020). Subsequently, due to slowed plate convergence and its own negative buoyancy, the Farallon slab steepened rapidly, which resulted in SSW-sweeping Eocene-Oligocene volcanism from Idaho to southern Nevada and WNW-sweeping Oligocene-Miocene volcanism across Arizona into California-Nevada (Coney and Reynolds, 1977; Humphreys, 1995; Copeland et al., 2017; Lund Snee and Miller, 2022) (Fig. 2A). A preceding correlative sweep of potassic volcanism may reflect melting of an enriched mantle source, indicating asthenospheric upwelling (e.g., Manley et al., 2000) following slab removal (Fig. 2A).
After, or potentially overlapping with, the phase of migrating Eocene-Miocene volcanism, MCCs developed across western North America as two distinct sets. In the north, Paleogene MCCs formed in the hinterland of the Sevier thrust front (Armstrong, 1968; Yonkee and Weil, 2015), from British Columbia, Canada, down to southern Nevada (Fig. 2). Conversely, in the south, Oligocene-Miocene MCCs formed in Arizona, eastern California, and southern Nevada, in the foreland region of the Sevier thrust front (Fig. 2). The hinterland MCCs have characteristic spacing of ~200 km, whereas the foreland MCCs are spaced ~50 km (Fig. 2A), defining an ~4:1 spacing ratio. Hinterland MCCs initiated while the Juan de Fuca plate was still subducting beneath North America, which was not yet in an extensional state (e.g., Stevens et al., 2017), whereas foreland MCCs developed during triple junction migration and regional extension (Atwater and Stock, 1998; Jepson et al., 2022) (Figs. 2B and 2C). Based on their locations relative to the Sevier thrust front, hinterland MCCs likely developed in thicker crust than the foreland MCCs. The timing and spacing represent a distinct dichotomy between the hinterland and foreland MCCs, which has not been satisfactorily explained with existing tectonic models.
Rayleigh-Taylor Instability Model for Metamorphic Core Complexes
To explain the MCC dichotomy, we propose a simple model that links MCC formation with the thermal state and thickness of crust. Our model is reminiscent of buoyant diapirism (i.e., Rayleigh-Taylor instability, RT) in a two-layer medium with a denser upper layer. Dimensional analysis (Selig, 1965) and analog models (Marsh, 1979) show characteristic diapir spacing, λ, is related to the viscosity contrast R = 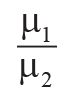 between the upper (µ1) and lower layers (µ2) (where µ2 ≤ µ1), and the thicknesses of the lower density lower crust layer, Hm. For a range of R, λ was plotted against Hm using analytical solutions to show the positive correlation between diapir spacing and Hm (Fig. 3A).
Figure 3
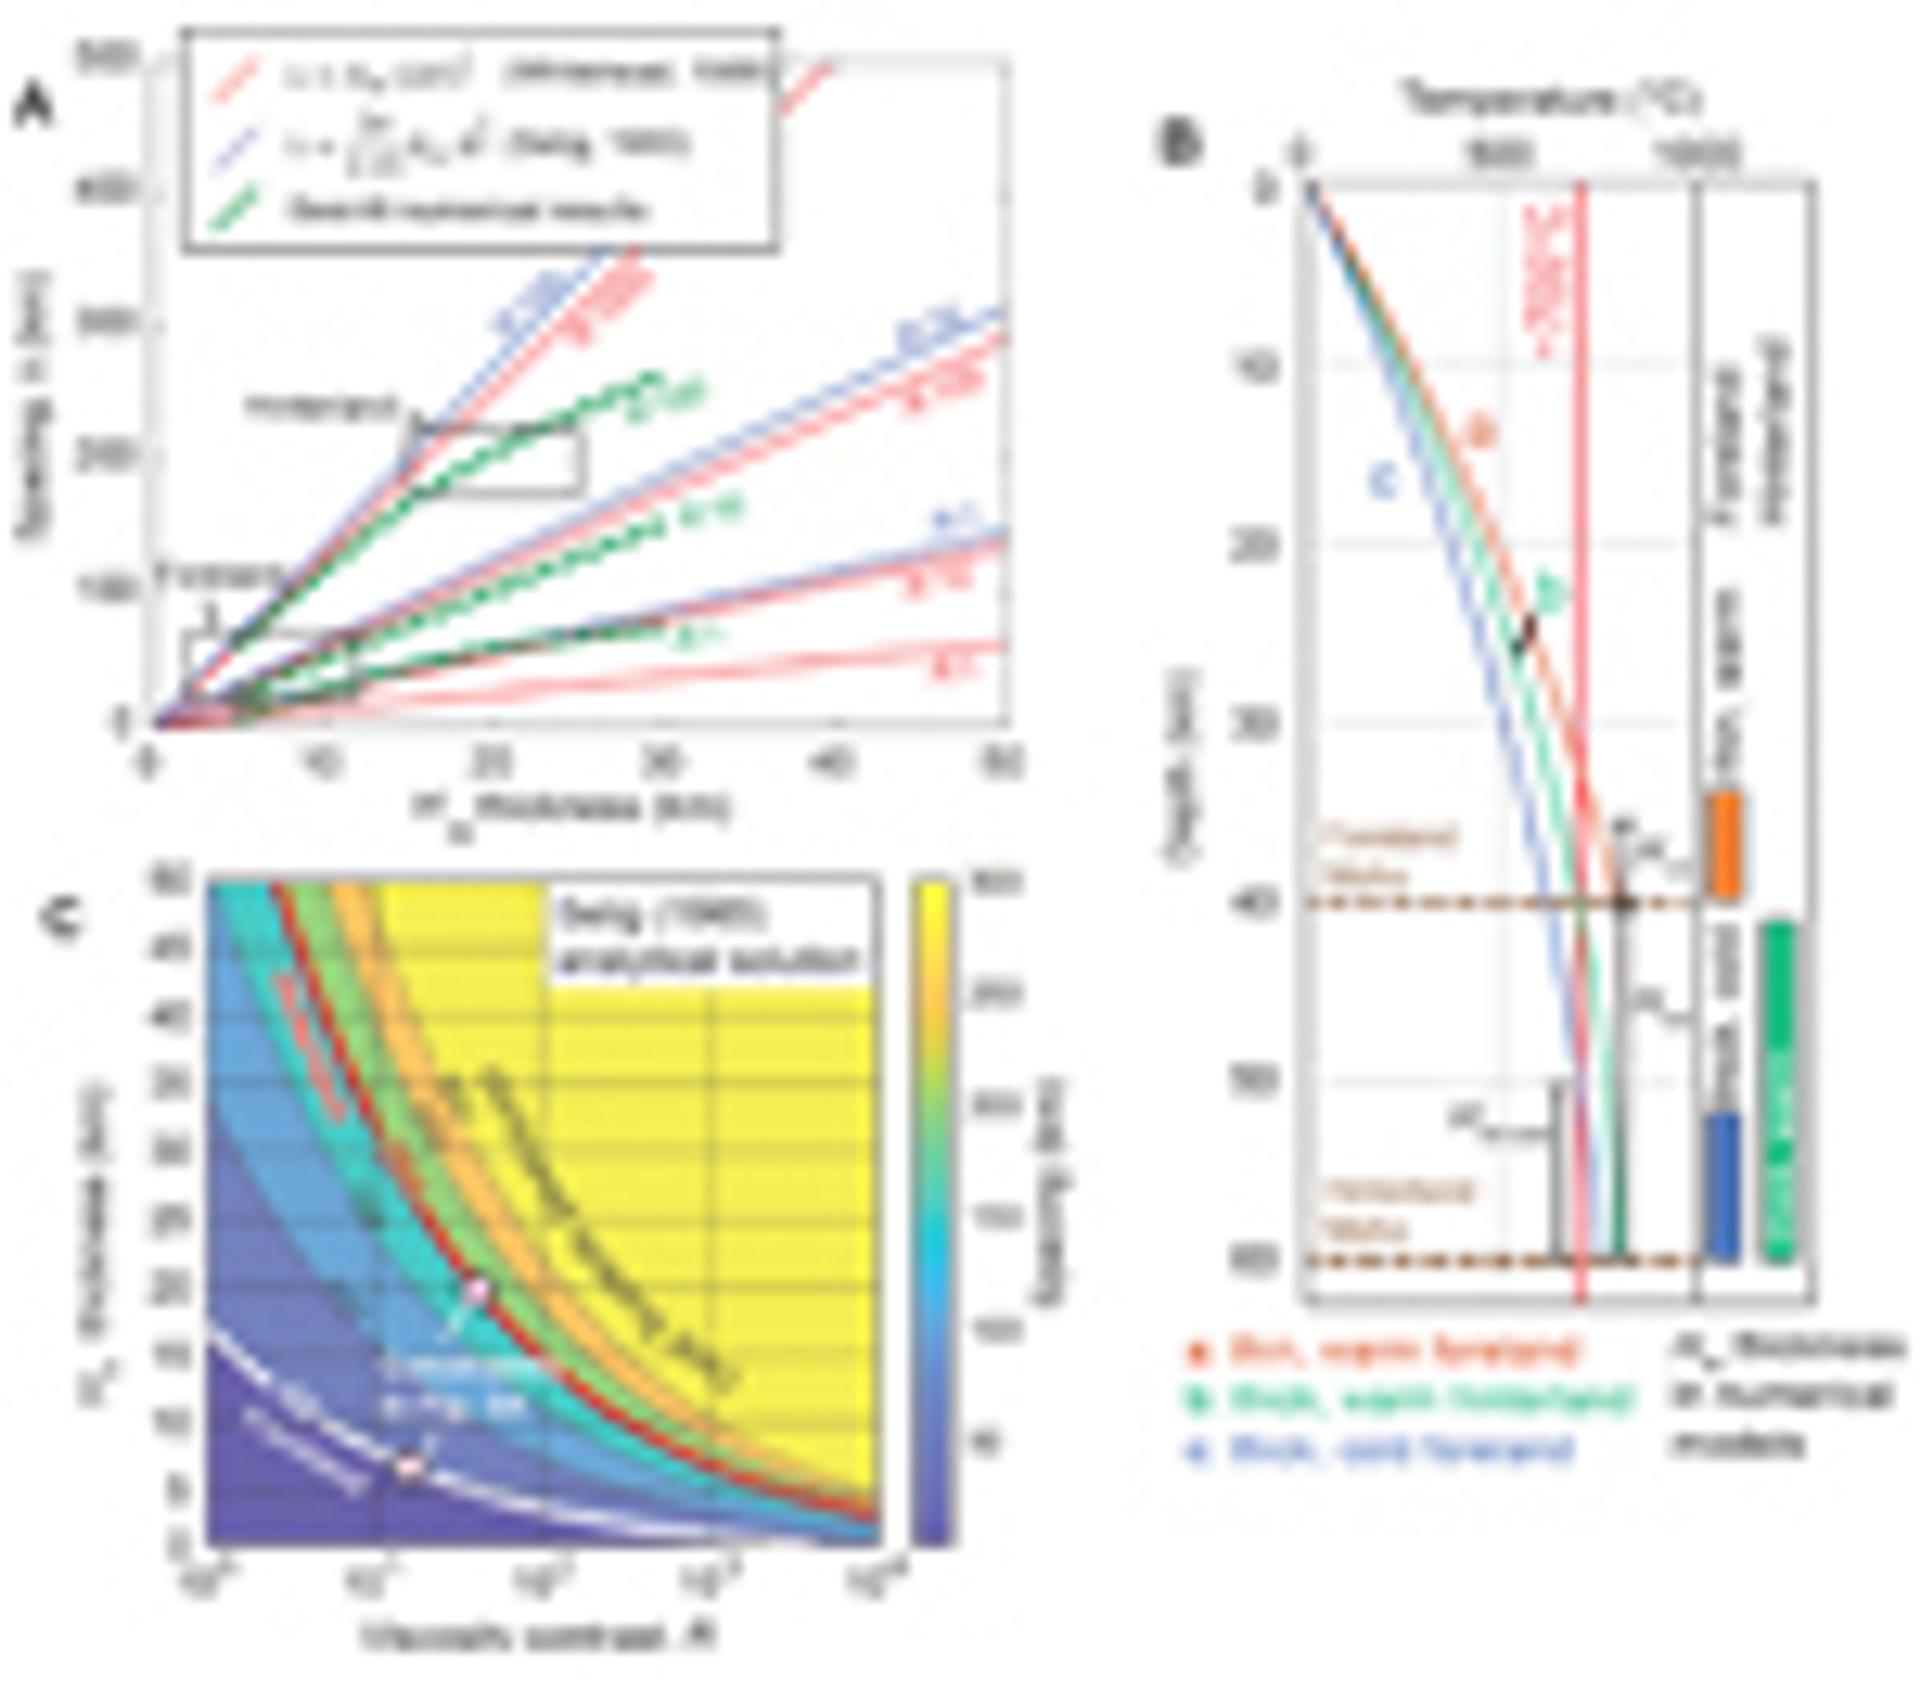
(A) Analytical and numerical predicted diapir spacing vs. the thickness of the lower density lower layer (Hm) for different viscosity contrasts (R), plotted with hinterland and foreland metamorphic core complex spacing (±1σ) and estimated Hm (±5 km) (from B). (B) Estimates of lower-layer thickness (above ~700 °C), assuming ~800 °C Moho, for the hinterland (Hmh), thin foreland (Hmf), or thick, cold (~750 °C Moho) foreland (Hmf cold). See text for explanation. Numerical models of partial melting confirm relative thickness differences (Supplemental Fig. 2 [see text footnote 1]). (C) Tradeoff between R and Hm for the Selig (1965) curve, with observed spacing contours emphasized.
To further support the analytical solutions, we conducted two-layer numerical models (Fig. 4) using the MVEP2 thermo-mechanical modeling package (Kaus, 2010; Thielmann and Kaus, 2012). The models used fixed boundaries, R = 1–100, and a constant density difference (Δρ = 0.1 g/cm3) between the two layers (see Methods in the Supplemental Material1) (Fig. 4). These models reproduced the analytical curves with similar λ versus Hm correlations (Fig. 3A). The spacing dependence on R paralleled the analytical solutions of Selig (1965).
-------
1 Supplemental Material. A synthesis of timing constraints for the North American Cordillera metamorphic core complexes, a brief discussion of the conjugate Shatsky Rise, details of zircon Hf compilation, and methods and results of numerical simulations. Go to https://doi.org/10.1130/GSAT.S.21253911 to access the supplemental material; contact editing@geosociety.org with any questions.
Our RT upwelling model suggests that distinct differences in thermal state and rheology between the hinterland and foreland regions of the North American Cordillera explain the observed MCC dichotomy (Fig. 2). Specifically, the model predicts that the wider-spaced hinterland MCCs developed with thicker Hm values, greater R values, or a combination of factors (Fig. 3A).
Figure 4
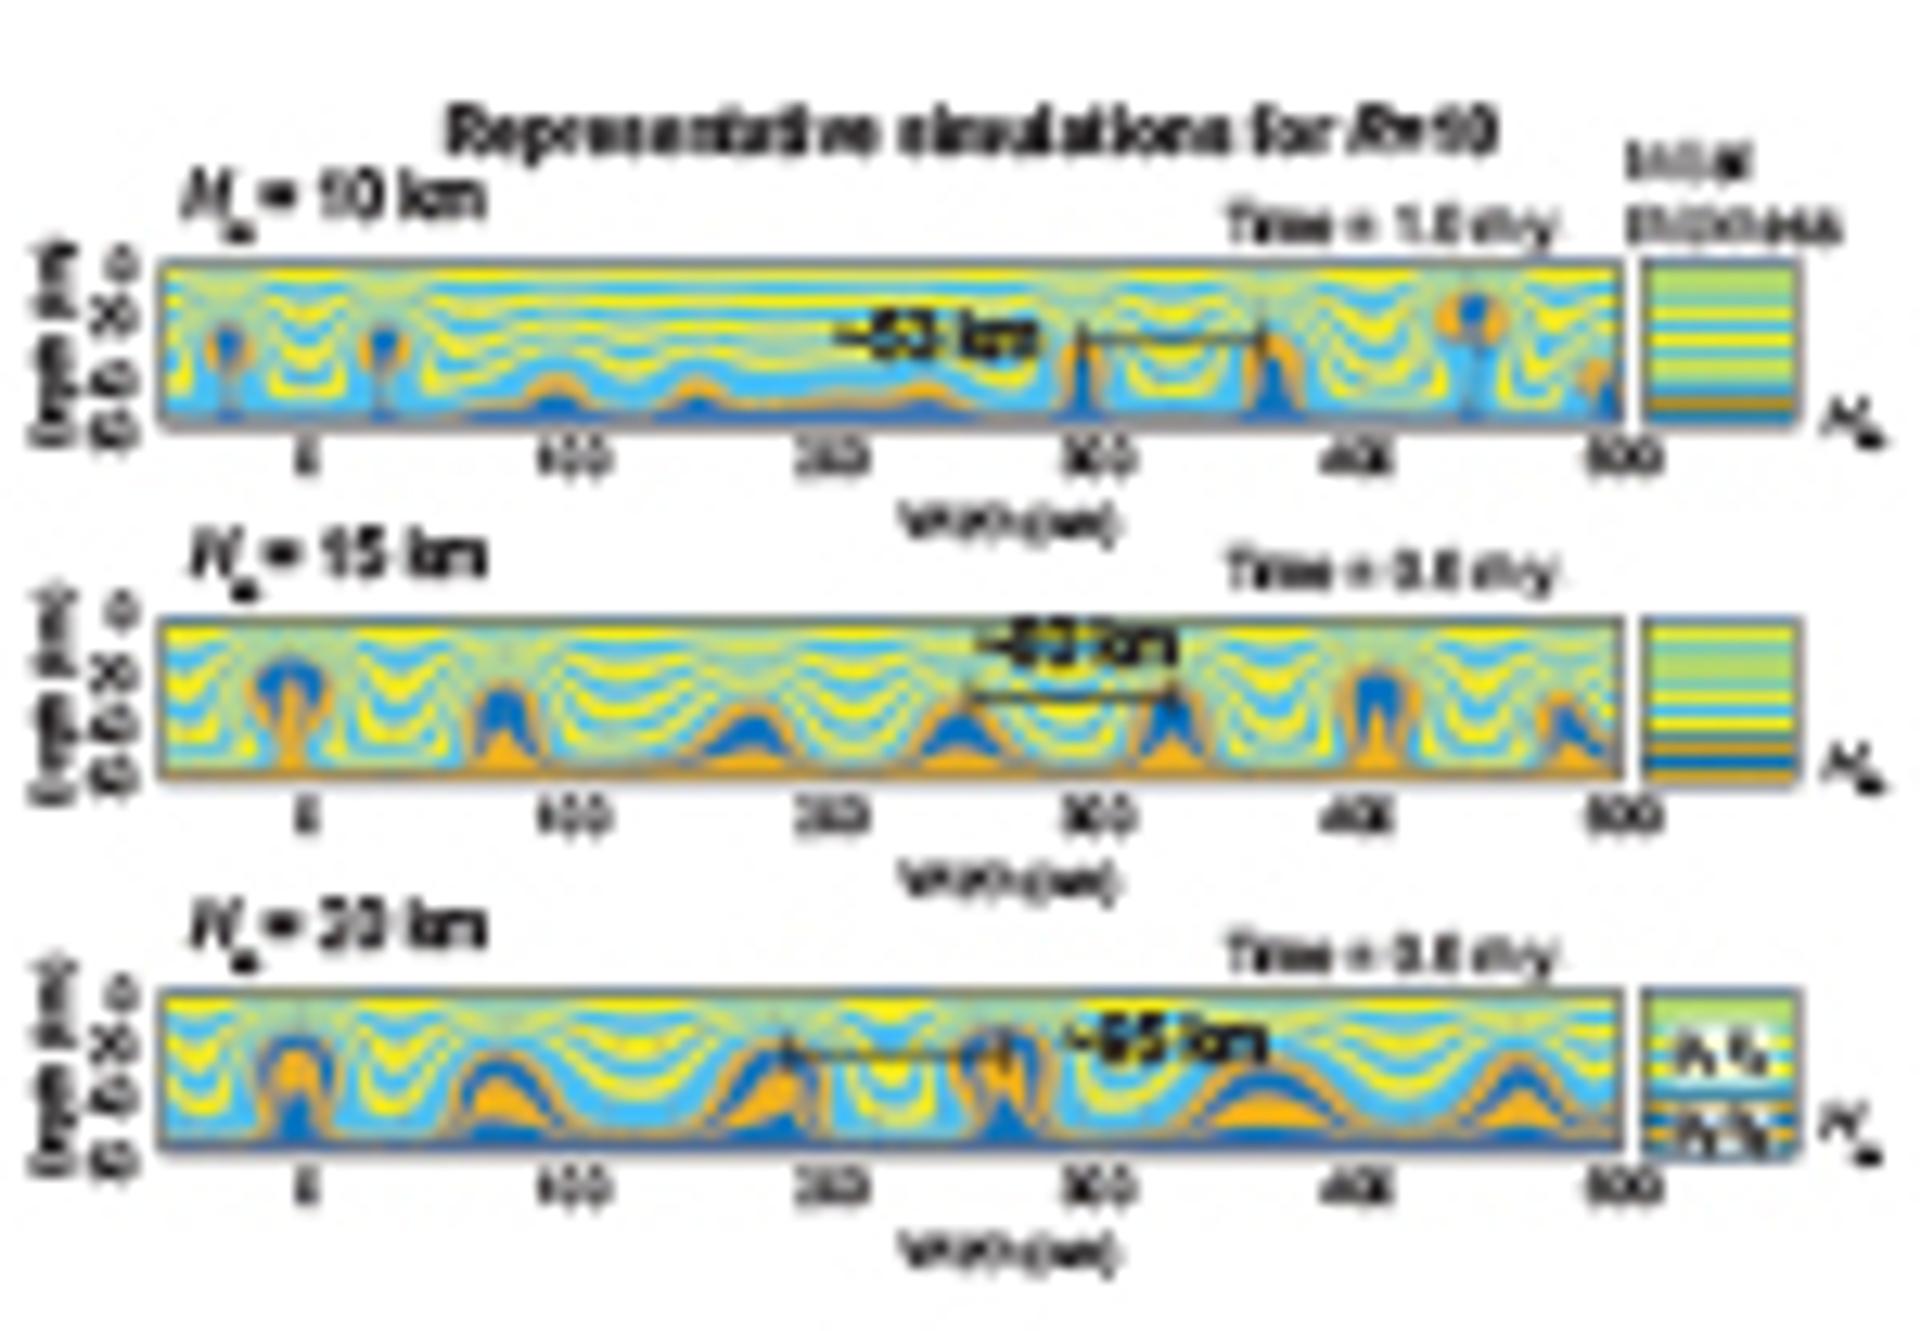
Representative numerical model results showing increased diapir spacing with increasing Hm. The upper layer is denser and ten times more viscous (R = 10); colored layers are passive to show strains. Complete simulation setup and results are in the Supplemental Materials (see text footnote 1).
Buoyant Doming in Variably Thick Crust
To test the RT model, we examined how Hm may have varied across the Cordillera, assuming Hm scales with the thickness of crust that might undergo partial melting above the solidus, say when T > 700 °C (e.g., Rey et al., 2009). In this framework, there are two parameters that affect Hm thickness: crustal thickness and the temperature at the base of the crust. Assuming similar thermal parameters in the crust, a thicker Hm will result from thicker crust or a hotter Moho.
The spatial location of the different MCCs in either the hinterland or foreland of the Sevier thrust front (Fig. 2A) implies that they developed in crust with variable thickness. Support for the Late Cretaceous Nevadaplano orogenic plateau (DeCelles, 2004) with relatively thick crust (~60+ km) in the Sevier hinterland includes observed deeply incised paleovalleys (Henry et al., 2012), geochemical thickness proxies (Chapman et al., 2015), moderate-to-high magnitudes of Mesozoic crustal shortening in the Sevier thrust belt and its hinterland (e.g., Long et al., 2014; Yonkee and Weil, 2015; Zuza et al., 2021), Late Cretaceous deep burial (~7–8 kbar) of supracrustal rocks in exhumed MCCs that supports substantial crustal thickening (Lewis et al., 1999; Hallett and Spear, 2014), reconstructions of Cenozoic extension that imply thickened pre-Cenozoic crust (Coney and Harms, 1984), and stable-isotope paleoaltimetry (e.g., Snell et al., 2014).
Conversely, direct evidence for substantial Mesozoic-Cenozoic crustal thickening in the foreland region is lacking. The region is southeast of the Sevier thrust-front and northeast of the Maria fold-thrust belt (e.g., Knapp and Heizler, 1990) (Fig. 2A). Structural reconstructions of Cretaceous–early Cenozoic contractional deformation do not suggest substantially thickened crust (e.g., Davis, 1979; Clinkscales and Lawton, 2018). Geochemical proxies suggest thickened crust across Arizona in the late Cretaceous (~60 km) but relatively thinner crust (~40 km) at 40–30 Ma (Jepson et al., 2022). Therefore, prior to the initiation of Oligocene-Miocene MCCs, we assume the foreland region was relatively thin at ~40 km.
Assuming a thicker hinterland (~60 km) and thinner foreland (~40 km) at the time of Cenozoic MCC generation, steady-state geotherms were plotted to examine the thickness of Hm above ~700 °C (Fig. 3B). We used an 800 °C Moho temperature to represent the hot lower crust heated via mantle upwelling after slab rollback. A set of numerical models simulating partial melting (Supplemental Materials [see footnote 1]) also support that the hinterland-type crust would have a thicker Hm than the foreland (right panel in Fig. 3B), Hmh versus Hmf, respectively. We estimate that the foreland lower crustal layer (Hmf) was ~7 km and the hinterland lower crustal layer (Hmh) was ~20 km, a ratio of ~3:1. With these estimates, a plot of MCC spacing versus Hm fits well on analytical curves, demonstrating a predictable positive correlation (Fig. 3A).
In this framework, observed MCC spacing overlap curves for diapirism with reasonable viscosity contrasts of 2–3 orders of magnitude between the partially melted lower crust and colder, more viscous upper crust (Fig. 3A) (Whitney et al., 2004; Rey et al., 2009). There is a tradeoff between viscosity contrast (R) and the thickness of the lower crustal layer (Hm), which we explored for Selig’s (1965) solution (Fig. 3C): observed spacing dichotomy may result from (1) nearly constant R in both the hinterland and foreland, which implies variable Hm (~3:1 ratio); (2) generally similar Hm, which implies substantial R variations between hinterland and foreland (~100:1 ratio); or (3) some intermediate scenario. We argue that variable Hm, modulated by thermal state or thickness discussed above (Fig. 3B), may be most responsible for spacing variations, which permits similar R values within each setting.
A potential caveat is that it has been postulated that Laramide flat-slab subduction could have refrigerated the upper plate to cool the Moho and thermal structure of the overlying crust (Dumitru et al., 1991). Reconstructions of the subducted CSR (Fig. 2A) show that it would have projected directly beneath the foreland MCCs but not the hinterland MCCs (Livaccari et al., 1981; Axen et al., 2018). This predicts that the foreland crust may have been colder than the hinterland, and therefore MCC diapirism in the colder foreland region would have emanated from an even thinner Hm layer than the hinterland. Although more complex, this scenario still satisfies our spacing arguments (Fig. 3). Furthermore, it is possible that Laramide thickening (Bird, 1984) of the Arizona region was more pronounced than we previously assumed (e.g., >45-km-thick crust), possibly driven by alternative thickening mechanisms beside crustal shortening that are hard to track in the geologic record, such as channel flow (Bird, 1991) or magmatic inflation (e.g., Chen et al., 2018). A potentially thicker foreland region would impact the MCC dichotomy model, but Laramide slab refrigeration may counteract this effect. That is, if the foreland was thick but relatively colder due to these combined impacts, a thinner Hm layer is predicted (Fig. 3A) to explain closer MCC spacing. Despite some uncertainties, thermal state through crustal thickness or basal temperature boundary conditions impact Hm (Fig. 3B) and thus diapir spacing (Fig. 3C).
Farallon Slab Dynamics Drive Lower Crustal Heating
Buoyant MCC doming is driven by vertical density differences in the crust, rather than plate-boundary forces, regional extension, hanging wall removal, and isostasy (Fig. 1). Heating of the lower crust reduces its density and viscosity, for example as shown by numerical simulations and tectonic models for some of the MCCs in southwest Canada (Vanderhaeghe et al., 1999; Rey et al., 2009; Whitney et al., 2013). We envision the RT instabilities initiated with an increase of Moho temperature caused by post-Laramide slab rollback, potentially coupled with slab-window development, that allowed influx of hot asthenosphere that intensely heated the crust (Babeyko et al., 2002; Axen, 2020; Lund Snee and Miller, 2022). Thus, the timing of MCC generation should be strongly coupled with the timing of volcanism and crustal heating, and not necessarily correlated with kinematic shifts in plate-boundary conditions and the initiation of regional extension.
To test this hypothesis, we compiled biotite and muscovite 40Ar/39Ar ages (Supplemental Material [see footnote 1]), which track cooling through closure temperatures of ~300 °C and 400 °C, respectively (McDougall and Harrison, 1999). We interpret these dates to broadly constrain the late phases of mylonite development in quartz-rich rocks along the flanks of the evolving MCCs. Lower temperature thermochronometers track brittle normal faulting and related exhumation. Argon dates from hinterland MCCs young to the southwest, whereas those from foreland MCCs young to the northwest (Fig. 2). MCC doming age patterns parallel volcanic trends (Gans et al., 1989), but only Ar dates from the foreland MCCs show a correlation with the propagation of initial regional Basin and Range extension tracked by plate reconstructions, low-temperature thermochronology, and the extensional basin record (Miller et al., 1999; Colgan et al., 2010; Konstantinou et al., 2013; Lee et al., 2017; Jepson et al., 2022; Supplemental Material [see footnote 1]) (Fig. 2). Our compilation of volcanism, MCC doming, regional extension, and triple-junction migration suggests that MCC development is more strongly correlated with trends of rollback volcanism rather than the propagation of regional extension due to migrating triple junctions (Fig. 2).
The implied causal relationship between magmatism and MCC generation can be further tested by magmatic source characteristics. All MCCs involve pre-/syn-kinematic magmatism (e.g., Gans et al., 1989; Howlett et al., 2021). Available zircon ɛHfT data from different but adjacent hinterland MCCs broadly overlap with parallel trends (Fig. 5A). ɛHfT trend toward evolved values (ɛHfT ≤ −20) during Late Cretaceous anatexis followed by a juvenile excursion (ɛHfT ~−10) during Eocene slab rollback reflecting mantle influx and melting (Howlett et al., 2021). An Oligocene evolution toward more evolved values (ɛHfT < −30) can be interpreted as protracted crustal heating and melting (Konstantinou et al., 2013) (Fig. 5A). Foreland MCCs show more subdued isotopic trends (Fig. 5B), likely reflecting different melt sources compared to the hinterland region. Within uncertainty, the foreland trend is either flat or there is a juvenile excursion with the arrival of mantle-derived volcanism (Fig. 5B). In the hinterland, there is a pronounced ~10-m.y. delay between juvenile magmatism and MCC doming (i.e., dth ~10 m.y., Fig. 5A) bracketed by Ar dates and cross-cutting relationships (e.g., Wright and Snoke, 1993; Konstantinou et al., 2013; Zuza et al., 2022) (Supplemental Material [see footnote 1]). Conversely, in the foreland, there is a much shorter delay between volcanism and MCC generation (i.e., dtf <1 m.y., Fig. 5B), and therefore dtf << dth (Fig. 5).
Figure 5
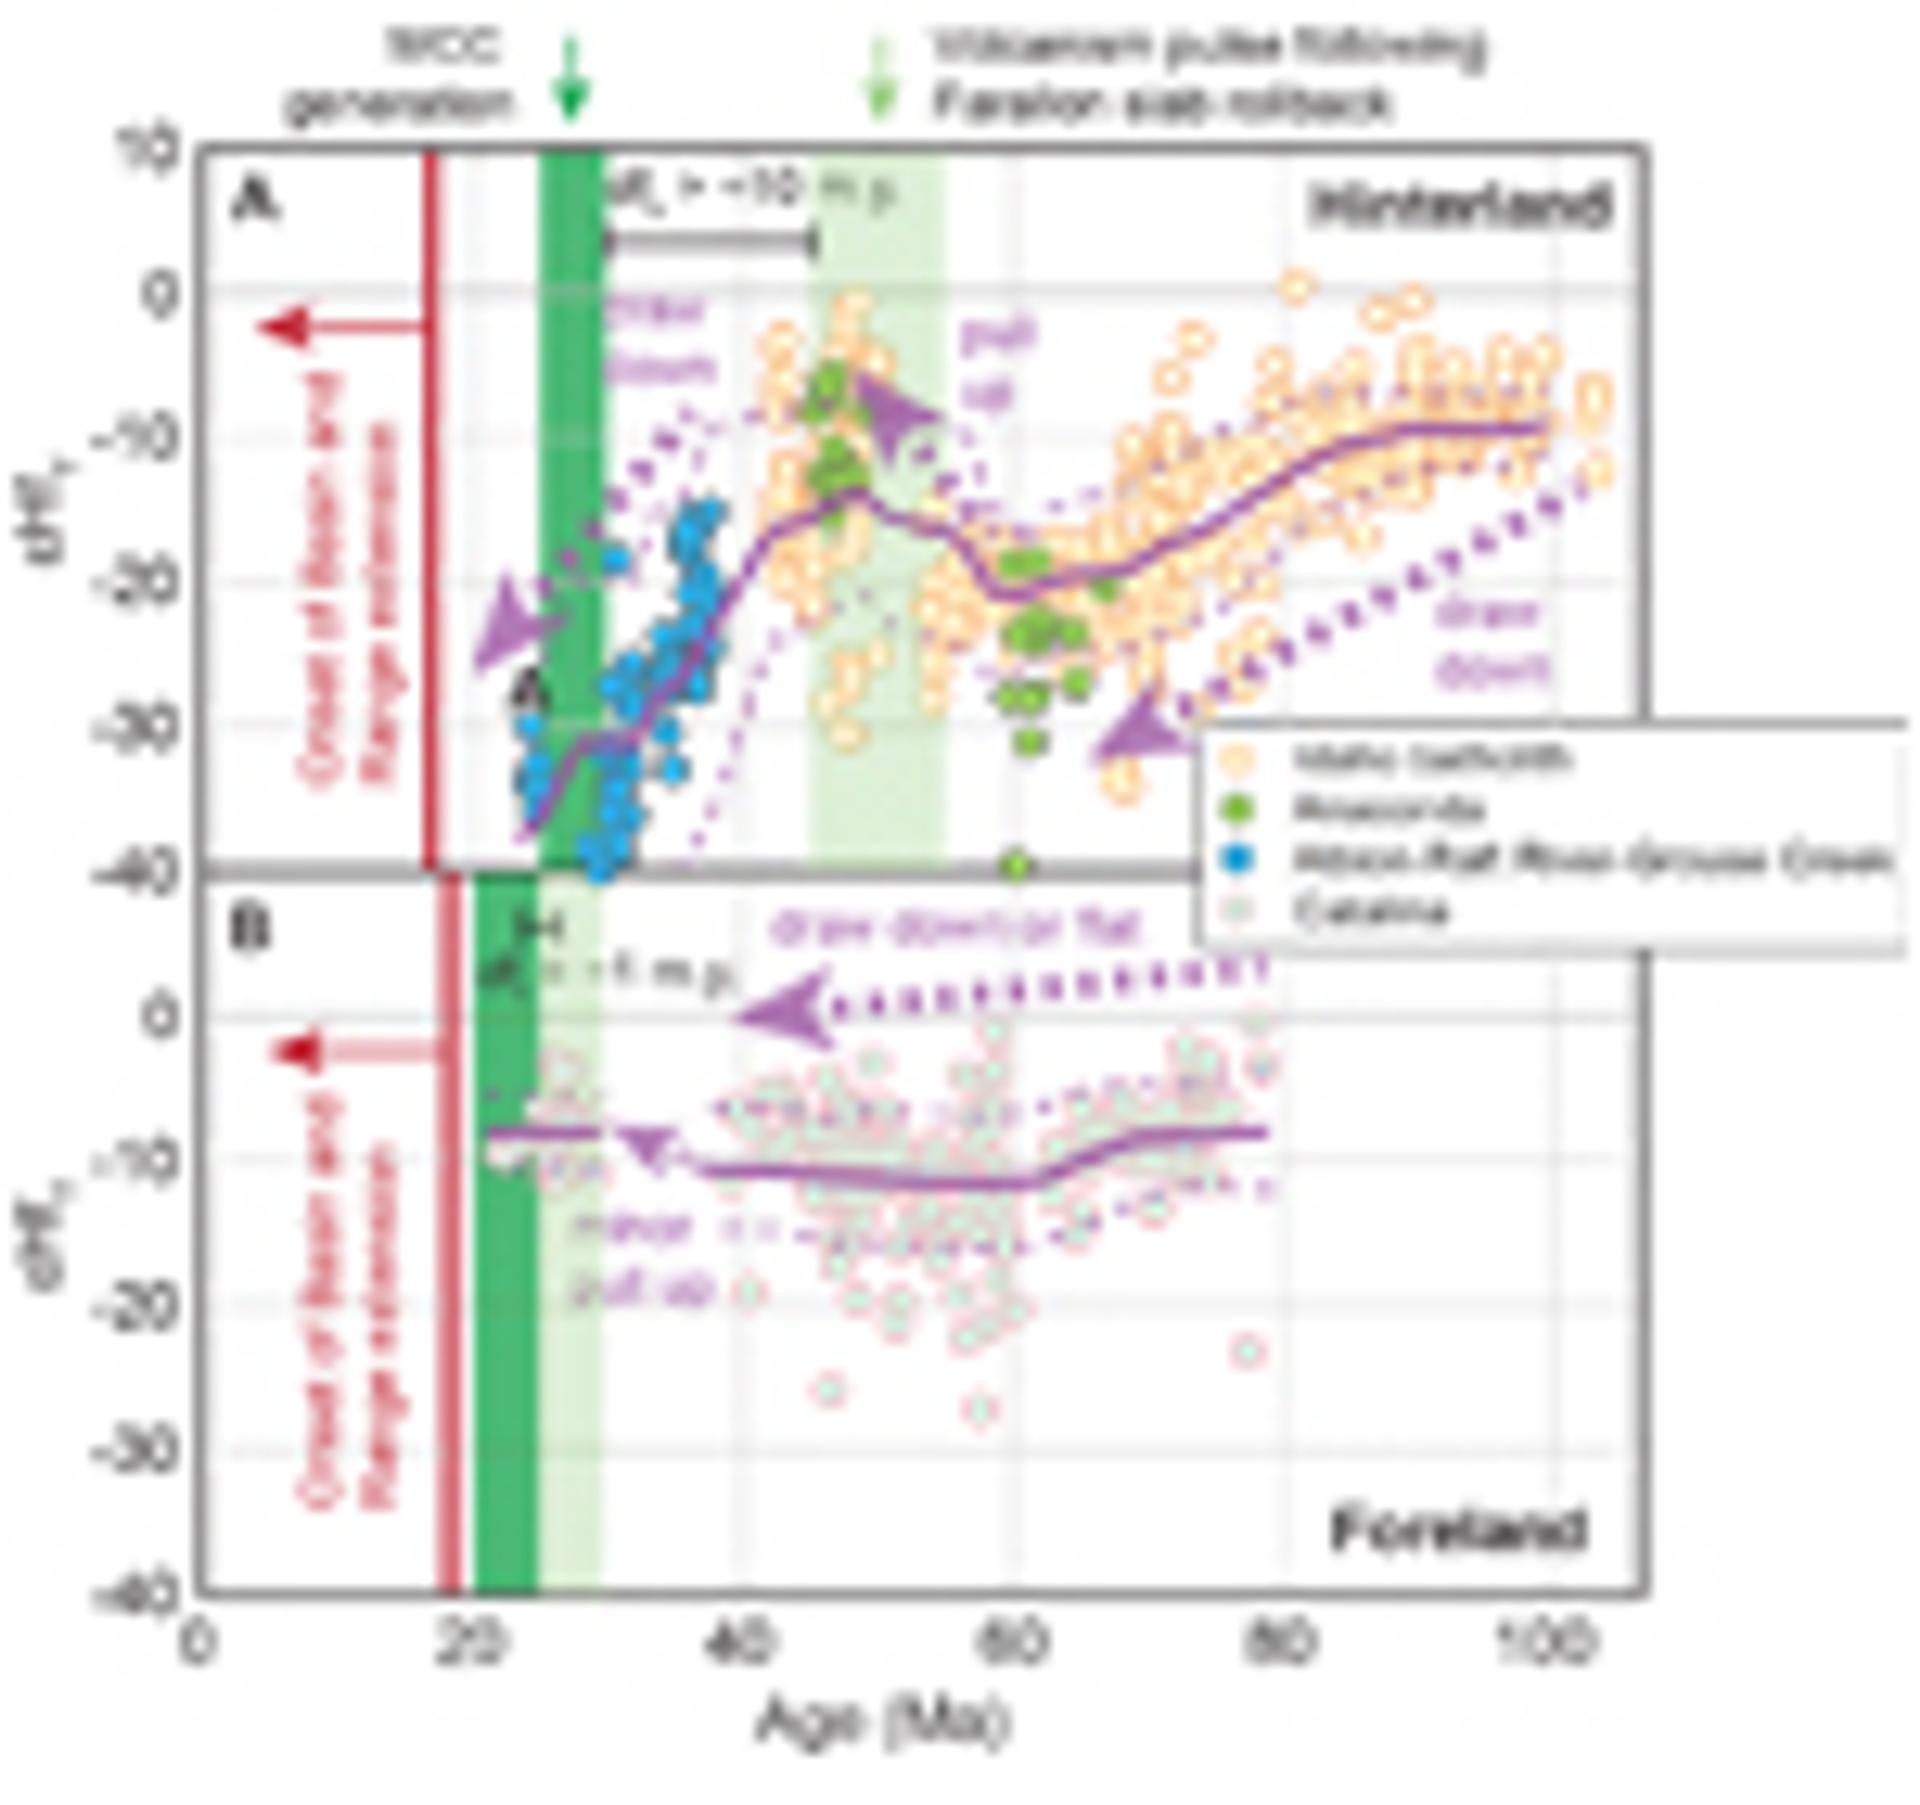
Zircon Hf compilation with 10-m.y. moving average (purple solid line) and standard deviation (dashed line). References in the Supplemental Material (see text footnote 1). (A) In the hinterland, note strong sawtooth pattern, with “pull up” correlated with Farallon slab removal and mantle-derived intrusions. Hf “drawn down” precedes mylonite generation after thermal incubation (dth > ~10 m.y.). (B) In the foreland, note the subdued sawtooth pattern with metamorphic core complex (MCC) generation shortly after upwelling volcanism (dtf), such that dtf < dth. Data: Gaschnig et al. (2011); Konstantinou et al. (2013); Fornash et al. (2013); Howlett et al. (2021).
Decoupled MCC Doming and Detachment Faulting
Advances in field and geochronology studies reveal a decoupled two-phase deformation history for the hinterland MCCs. In the Albion–Raft River–Grouse Creek, the primary mylonitic shear zones formed in the Oligocene and Basin and Range extensional faulting started ca. 14 Ma (Konstantinou et al., 2013). In the northern Ruby Mountains–East Humboldt Range, Oligocene mylonites are crosscut by undeformed 17 Ma basalt dikes, which are cut by Miocene detachment faults that were associated with syn-kinematic extensional basin sedimentation (Wright and Snoke, 1993; Zuza et al., 2021, 2022). The Miocene detachment continues south along strike for ~150 km (Colgan et al., 2010), where its footwall is no longer mylonitic or migmatitic, thus suggesting the mylonites are not genetically or kinematically linked with detachment faulting. In the Snake Range, the Oligocene mylonitic shear zone was cut by ca. 22 Ma undeformed dikes (Lee et al., 2017), and a later phase of extensional exhumation is recorded by ca. 17 Ma fission track ages (Miller et al., 1999).
We posit that for hinterland MCCs, the earlier, temporally decoupled phase of buoyant doming established mechanical or thermal weaknesses that were exploited by Miocene detachment faulting, thus explaining the apparent connectivity between Paleogene doming and Miocene detachment faults (e.g., Konstantinou et al., 2013; Ducea et al., 2020; Zuza et al., 2021) (Fig. 2A). This also explains the perplexing observation that Paleogene MCCs did not generate syn-kinematic basins, whereas Miocene extensional basins were well developed (Colgan and Henry, 2009; Zuza et al., 2021). Domal upwarps in the mid-crust did not generate space for surface sedimentation, but hanging wall removal during detachment faulting allowed for supra-detachment basins (e.g., Friedmann and Burbank, 1995). Foreland MCCs may have similarly involved two phases that occurred on nearly overlapping time scales (Jepson et al., 2022) due to coeval slab-window development, magmatism, and extension initiation (Atwater and Stock, 1998) (Fig. 2).
Extension-related detachment fault models for MCC generation (e.g., Wernicke and Axen, 1988) (Fig. 1A) cannot satisfactorily explain MCC spacing, age trends, and generation prior to plate-boundary conditions switched to initiate regional extension (Fig. 2). MCC spacing has previously been interpreted in the context of elastic buckling (e.g., Yin, 1991), but this type of instantaneous solution does not uniquely constrain observed age trends across the Cordillera (Fig. 2) and diminishes the role of a viscous, partial-melt–rich mid-lower crust. The aforementioned two-phase deformation history of many MCCs complicates models of simple protracted detachment faulting. However, it remains possible that some MCC spacing is partially modulated by corrugations or elastic buckling that overprinted an established first-order buoyantly domed architecture.
A comprehensive summary model in Figure 6 unifies observations from across the Cordillera and provides testable predictions for future investigations. Mesozoic shortening thickened the hinterland region more than the foreland. Laramide flat-slab subduction underplated schists beneath the foreland region, potentially refrigerating the upper-plate lithosphere. In the hinterland, post-Laramide slab rollback drove SW sweeping juvenile magmatism that heated the crust. Thermal incubation over ~10 m.y. resulted in a hot, melt-rich lower crust that rose as buoyant diapirs to form hinterland gneiss dome MCCs with strong shearing along the upwelling margins (Fig. 1B). This style of MCC development resulted in pure-shear attenuation along the flanks and tops of the rising domes (Miller et al., 1983; Zuza et al., 2022). Paleogene doming would have overprinted and incorporated preexisting Mesozoic fabrics and structures, thus creating locally complex domal geometries. Detachment faulting during Miocene-present Basin and Range extension exploited the domal structures to exhume them in the detachment footwalls (Fig. 1C).
Figure 6
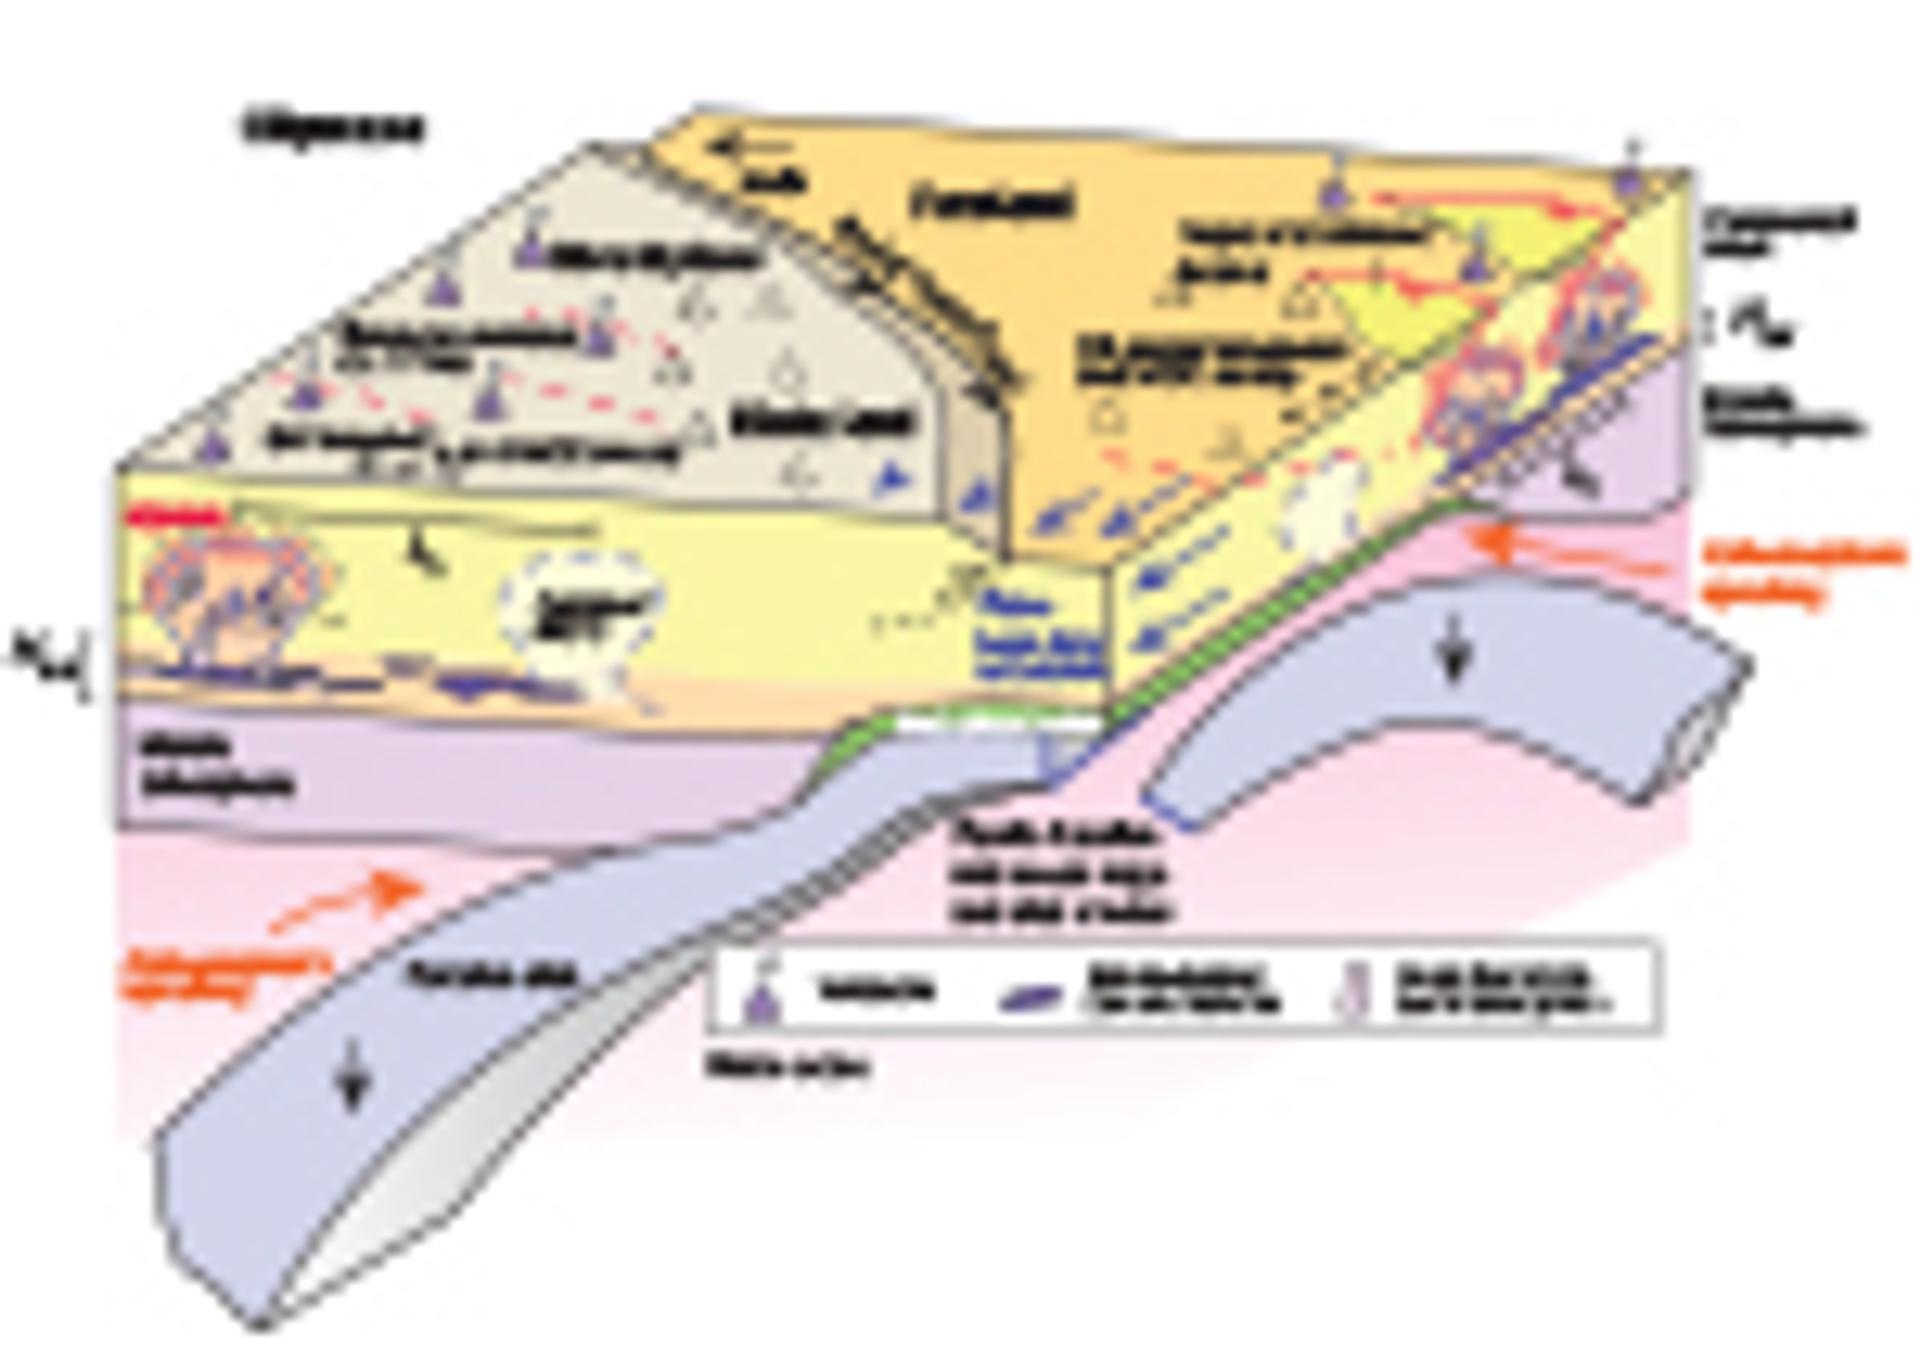
Model for metamorphic core complex (MCC) dichotomy in the North American Cordillera explained by buoyant upwelling in variably thick crust, including predictions for temporal trends, phases of thermal incubation, and connections with regional extension. Hmh and Hmf—thickness of the low density, lower crust layer in the hinterland and foreland, respectively; λh and λf—diapir spacing in the hinterland and foreland, respectively.
The spatial correspondence of the CSR and slab window beneath the foreland region may imply complex influence on MCC generation, including earlier lithospheric refrigeration and hydration followed by focused heating of the base of the crust. Coupled mantle upwelling through the slab window and a plate configuration conducive to regional extension drove diapiric upwellings that were almost immediately (within several m.y.) impacted by regional extension. Detachment faults captured the rising domes in their footwalls, resulting in more traditional kinematic evolution and geometries, with more stratigraphic omission and syn-kinematic basins (Fig. 1C).
The development of the classic North American Cordillera MCC belt was not uniquely and initially driven by regional extension because the hinterland MCCs developed before mid-Miocene plate-boundary conditions drove regional extension (Colgan and Henry, 2009). Instead, we argue that Farallon slab dynamics and subsequent mantle heating led to buoyant RT upwellings at characteristic spacings. Individual MCCs undoubtedly experienced differing Mesozoic-Cenozoic geologic histories, but as outlined here, the thickness and thermal state of the crust exerted a first-order control on the observed MCC dichotomy. Our model may be transferrable to other similar coupled subduction-intraplate settings. Mesozoic subduction in southeast China involved MCC generation following Jurassic-Cretaceous flat-slab subduction, rollback, and mantle-derived magmatism (Li and Li, 2007), similar to North America. The links between flat-slab events, subsequent rollback, magmatism, partial melting, and heat redistribution during MCC development require further evaluation.
Acknowledgments
This research was supported by the National Science Foundation EAR-1830139 and the U.S. Geological Survey STATEMAP program. We thank two reviewers and editor Schmitt.
References Cited
- Armstrong, R.L., 1968, Sevier orogenic belt in Nevada and Utah: Geological Society of America Bulletin, v. 79, p. 429–458, https://doi.org/10.1130/0016-7606(1968)79[429:SOBINA]2.0.CO;2.
- Atwater, T., and Stock, J., 1998, Pacific-North America plate tectonics of the Neogene southwestern United States: An update: International Geology Review, v. 40, p. 375–402, https://doi.org/10.1080/00206819809465216.
- Axen, G.J., 2020, How a strong low-angle normal fault formed: The Whipple detachment, southeastern California: Geological Society of America Bulletin, v. 132, p. 1817–1828, https://doi.org/10.1130/B35386.1.
- Axen, G.J., van Wijk, J.W., and Currie, C.A., 2018, Basal continental mantle lithosphere displaced by flat-slab subduction: Nature Geoscience, v. 11, p. 961–964, https://doi.org/10.1038/s41561-018-0263-9.
- Babeyko, A.Y., Sobolev, S.V., Trumbull, R.B., Oncken, O., and Lavier, L.L., 2002, Numerical models of crustal scale convection and partial melting beneath the Altiplano-Puna plateau: Earth and Planetary Science Letters, v. 199, p. 373–388, https://doi.org/10.1016/S0012-821X(02)00597-6.
- Bird, P., 1984, Laramide crustal thickening event in the Rocky Mountain foreland and Great Plains: Tectonics, v. 3, p. 741–758, https://doi.org/10.1029/TC003i007p00741.
- Bird, P., 1991, Lateral extrusion of lower crust from under high topography in the isostatic limit: Journal of Geophysical Research. Solid Earth, v. 96, p. 10,275–10,286, https://doi.org/10.1029/91JB00370.
- Chapman, A.D., Rautela, O., Shields, J., Ducea, M.N., and Saleeby, J., 2020, Fate of the lower lithosphere during shallow-angle subduction: The Laramide example: GSA Today, v. 30, p. 4–10, https://doi.org/10.1130/GSATG412A.1.
- Chapman, J.B., Ducea, M.N., DeCelles, P.G., and Profeta, L., 2015, Tracking changes in crustal thickness during orogenic evolution with Sr/Y: An example from the North American Cordillera: Geology, v. 43, p. 919–922, https://doi.org/10.1130/G36996.1.
- Chen, J.L., Yin, A., Xu, J.F., Dong, Y.H., and Kang, Z.Q., 2018, Late Cenozoic magmatic inflation, crustal thickening, and >2 km of surface uplift in central Tibet: Geology, v. 46, p. 19–22, https://doi.org/10.1130/G39699.1.
- Clennett, E.J., Sigloch, K., Mihalynuk, M.G., Seton, M., Henderson, M.A., Hosseini, K., Mohammadzaheri, A., Johnston, S.T., and Müller, R.D., 2020, A quantitative tomotectonic plate reconstruction of western North America and the eastern Pacific basin: Geochemistry, Geophysics, Geosystems, v. 21, no. 8, https://doi.org/10.1029/2020GC009117.
- Clinkscales, C.A., and Lawton, T.F., 2018, Mesozoic–Paleogene structural evolution of the southern U.S. Cordillera as revealed in the Little and Big Hatchet Mountains, southwest New Mexico, USA: Geosphere, v. 14, p. 162–186, https://doi.org/10.1130/GES01539.1.
- Colgan, J.P., and Henry, C.D., 2009, Rapid middle Miocene collapse of the Mesozoic orogenic plateau in north-central Nevada: International Geology Review, v. 51, p. 920–961, https://doi.org/10.1080/00206810903056731.
- Colgan, J.P., Howard, K.A., Fleck, R.J., and Wooden, J.L., 2010, Rapid middle Miocene extension and unroofing of the southern Ruby Mountains, Nevada: Tectonics, v. 29, no. 6, https://doi.org/10.1029/2009TC002655.
- Coney, P.J., 1980, Cordilleran metamorphic core complexes: An overview, in Crittenden, M.D., Jr., Coney, P.J., and Davis, G.H., eds., Cordilleran Metamorphic Core Complexes: Geological Society of America Memoir 153, p. 7–31, https://doi.org/10.1130/MEM153-p7.
- Coney, P.J., and Harms, T.A., 1984, Cordilleran metamorphic core complexes: Cenozoic extensional relics of Mesozoic compression: Geology, v. 12, p. 550–554, https://doi.org/10.1130/0091-7613(1984)12<550:CMCCCE>2.0.CO;2.
- Coney, P.J., and Reynolds, S.J., 1977, Cordilleran Benioff zones: Nature, v. 270, p. 403–406, https://doi.org/10.1038/270403a0.
- Copeland, P., Currie, C.A., Lawton, T.F., and Murphy, M.A., 2017, Location, location, location: The variable lifespan of the Laramide orogeny: Geology, v. 45, p. 223–226, https://doi.org/10.1130/G38810.1.
- Davis, G.H., 1979, Laramide folding and faulting in southeastern Arizona: American Journal of Science, v. 279, p. 543–569, https://doi.org/10.2475/ajs.279.5.543.
- DeCelles, P.G., 2004, Late Jurassic to Eocene evolution of the Cordilleran thrust belt and foreland basin system, western USA: American Journal of Science, v. 304, p. 105–168, https://doi.org/10.2475/ajs.304.2.105.
- Ducea, M.N., Triantafyllou, A., and Krcmaric, J., 2020, New timing and depth constraints for the Catalina metamorphic core complex, southeast Arizona: Tectonics, v. 39, no. 8, https://doi.org/10.1029/2020TC006383.
- Dumitru, T.A., Gans, P.B., Foster, D.A., and Miller, E.L., 1991, Refrigeration of the western Cordilleran lithosphere during Laramide shallow-angle subduction: Geology, v. 19, p. 1145–1148, https://doi.org/10.1130/0091-7613(1991)019<1145:ROTWCL>2.3.CO;2.
- Eskola, P.E., 1949, The problem of mantled gneiss domes: Geological Society of London Quarterly Journal, v. 104, p. 461–476.
- Fornash, K.F., Patchett, P.J., Gehrels, G.E., and Spencer, J.E., 2013, Evolution of granitoids in the Catalina metamorphic core complex, southeastern Arizona: U-Pb, Nd, and Hf isotopic constraints: Contributions to Mineralogy and Petrology, v. 165, p. 1295–1310, https://doi.org/10.1007/s00410-013-0859-4.
- Friedmann, S.J., and Burbank, D.W., 1995, Rift basins and supradetachment basins: Intracontinental extensional end-members: Basin Research, v. 7, p. 109–127, https://doi.org/10.1111/j.1365-2117.1995.tb00099.x.
- Gans, P.B., Mahood, G.A., and Schermer, E., 1989, Synextensional magmatism in the Basin and Range province: A case study from the eastern Great Basin: Geological Society of America Special Paper 233, https://doi.org/10.1130/SPE233-p1.
- Gaschnig, R.M., Vervoort, J.D., Lewis, R.S., and Tikoff, B., 2011, Isotopic evolution of the Idaho batholith and Challis intrusive province, northern US Cordillera: Journal of Petrology, v. 52, p. 2397–2429, https://doi.org/10.1093/petrology/egr050.
- Hallett, B.W., and Spear, F.S., 2014, The P–T history of anatectic pelites of the Northern East Humboldt Range, Nevada: Evidence for tectonic loading, decompression, and anatexis: Journal of Petrology, v. 55, p. 3–36, https://doi.org/10.1093/petrology/egt057.
- Henry, C.D., and Hinz, N.H., Faulds, J.E., Colgan, J.P., John, D.A., Brooks, E.R., Cassel, E.J., Garside, L.J., Davis, D.A., and Castor, S.B., 2012, Eocene–Early Miocene paleotopography of the Sierra Nevada–Great Basin–Nevadaplano based on widespread ash-flow tuffs and paleovalleys: Geosphere, v. 8, p. 1–27, https://doi.org/10.1130/GES00727.1.
- Howlett, C.J., Reynolds, A.N., and Laskowski, A.K., 2021, Magmatism and extension in the Anaconda metamorphic core complex of western Montana and relation to regional tectonics: Tectonics, v. 40, no. 9, https://doi.org/10.1029/2020TC006431.
- Humphreys, E.D., 1995, Post-Laramide removal of the Farallon slab, western United States: Geology, v. 23, p. 987–990, https://doi.org/10.1130/0091-7613(1995)023<0987:PLROTF>2.3.CO;2.
- Jepson, G., Carrapa, B., George, S., Reeher, L., Kapp, P., Davis, G., Thomson, S., Amadori, C., Clinkscales, C., Jones, S., Gleadow, A.J.W., and Kohn, B.P., 2022, Where did the Arizona-plano go? Protracted thinning via upper- to lower-crustal processes: Journal of Geophysical Research. Solid Earth, https://doi.org/10.1029/2021JB023850.
- Kaus, B.J., 2010, Factors that control the angle of shear bands in geodynamic numerical models of brittle deformation: Tectonophysics, v. 484, p. 36–47, https://doi.org/10.1016/j.tecto.2009.08.042.
- Knapp, J.H., and Heizler, M.T., 1990, Thermal history of crystalline nappes of the Maria fold and thrust belt, west central Arizona: Journal of Geophysical Research. Solid Earth, v. 95, p. 20,049–20,073, https://doi.org/10.1029/JB095iB12p20049.
- Konstantinou, A., Strickland, A., Miller, E., Vervoort, J., Fisher, C.M., Wooden, J., and Valley, J., 2013, Synextensional magmatism leading to crustal flow in the Albion–Raft River–Grouse Creek metamorphic core complex, northeastern Basin and Range: Tectonics, v. 32, p. 1384–1403, https://doi.org/10.1002/tect.20085.
- Lee, J., Blackburn, T., and Johnston, S., 2017, Timing of mid-crustal ductile extension in the northern Snake Range metamorphic core complex, Nevada: Evidence from U/Pb zircon ages: Geosphere, v. 13, p. 439–459, https://doi.org/10.1130/GES01429.1.
- Lewis, C.J., Wernicke, B.P., Selverstone, J., and Bartley, J.M., 1999, Deep burial of the footwall of the northern Snake Range decollement, Nevada: Geological Society of America Bulletin, v. 111, p. 39–51, https://doi.org/10.1130/0016-7606(1999)111<0039:DBOTFO>2.3.CO;2.
- Li, Z.X., and Li, X.H., 2007, Formation of the 1300-km-wide intracontinental orogen and postorogenic magmatic province in Mesozoic South China: A flat-slab subduction model: Geology, v. 35, p. 179–182, https://doi.org/10.1130/G23193A.1.
- Livaccari, R.F., Burke, K., and Şengör, A.M.C., 1981, Was the Laramide orogeny related to subduction of an oceanic plateau?: Nature, v. 289, p. 276–278, https://doi.org/10.1038/289276a0.
- Long, S.P., Henry, C.D., Muntean, J.L., Edmondo, G.P., and Cassel, E.J., 2014, Early Cretaceous construction of a structural culmination, Eureka, Nevada, USA: Implications for out-of-sequence deformation in the Sevier hinterland: Geosphere, v. 10, p. 564–584, https://doi.org/10.1130/GES00997.1.
- Lund Snee, J.E., and Miller, E.L., 2022, Magmatism, migrating topography, and the transition from Sevier shortening to Basin and Range extension, western United States, in Craddock, J.P., Malone, D.H., Foreman, B.Z., and Konstantinou, A., eds., Tectonic Evolution of the Sevier-Laramide Hinterland, Thrust Belt, and Foreland, and Postorogenic Slab Rollback (180–20 Ma): Geological Society of America Special Paper 555, p. 335–357, https://doi.org/10.1130/2021.2555(13).
- Manley, C.R., Glazner, A.F., and Farmer, G.L., 2000, Timing of volcanism in the Sierra Nevada of California: Evidence for Pliocene delamination of the batholithic root?: Geology, v. 28, p. 811–814, https://doi.org/10.1130/0091-7613(2000)28<811:TOVITS>2.0.CO;2.
- Marsh, B.D., 1979, Island arc development: Some observations, experiments, and speculations: The Journal of Geology, v. 87, p. 687–713, https://doi.org/10.1086/628460.
- McDougall, I., and Harrison, T.M., 1999, Geochronology and Thermochronology by the 40Ar/39Ar Method: Oxford, UK, Oxford University Press, 288 p.
- Miller, E.L., Gans, P.B., and Garing, J., 1983, The Snake Range decollement: An exhumed mid-Tertiary ductile-brittle transition: Tectonics, v. 2, p. 239–263, https://doi.org/10.1029/TC002i003p00239.
- Miller, E.L., Dumitru, T.A., Brown, R.W., and Gans, P.B., 1999, Rapid Miocene slip on the Snake Range–Deep Creek range fault system, east-central Nevada: Geological Society of America Bulletin, v. 111, p. 886–905, https://doi.org/10.1130/0016-7606(1999)111<0886:RMSOTS>2.3.CO;2.
- Moore, W.B., and Webb, A.A.G., 2013, Heat-pipe earth: Nature, v. 501, p. 501–505, https://doi.org/10.1038/nature12473.
- Platt, J.P., Behr, W.M., and Cooper, F.J., 2015, Metamorphic core complexes: Windows into the mechanics and rheology of the crust: Journal of the Geological Society, v. 172, p. 9–27, https://doi.org/10.1144/jgs2014-036.
- Rey, P.F., Teyssier, C., and Whitney, D.L., 2009, Extension rates, crustal melting, and core complex dynamics: Geology, v. 37, p. 391–394, https://doi.org/10.1130/G25460A.1.
- Selig, F., 1965, A theoretical prediction of salt dome patterns: Geophysics, v. 30, p. 633–643, https://doi.org/10.1190/1.1439634.
- Snell, K.E., Koch, P.L., Druschke, P., Foreman, B.Z., and Eiler, J.M., 2014, High elevation of the ‘Nevadaplano’ during the Late Cretaceous: Earth and Planetary Science Letters, v. 386, p. 52–63, https://doi.org/10.1016/j.epsl.2013.10.046.
- Stevens, L.M., Bendick, R., and Baldwin, J.A., 2017, Synconvergent exhumation of metamorphic core complexes in the northern North American Cordillera: Geology, v. 45, p. 495–498, https://doi.org/10.1130/G38802.1.
- Thielmann, M., and Kaus, B.J., 2012, Shear heating induced lithospheric-scale localization: Does it result in subduction?: Earth and Planetary Science Letters, v. 359–360, p. 1–13, https://doi.org/10.1016/j.epsl.2012.10.002.
- Vanderhaeghe, O., Teyssier, C., and Wysoczanski, R., 1999, Structural and geochronological constraints on the role of partial melting during the formation of the Shuswap metamorphic core complex at the latitude of the Thor-Odin dome, British Columbia: Canadian Journal of Earth Sciences, v. 36, p. 917–943, https://doi.org/10.1139/e99-023.
- Wernicke, B., 1981, Low-angle normal faults in the Basin and Range Province: Nappe tectonics in an extending orogen: Nature, v. 291, p. 645–648, https://doi.org/10.1038/291645a0.
- Wernicke, B., and Axen, G.J., 1988, On the role of isostasy in the evolution of normal fault systems: Geology, v. 16, p. 848–851, https://doi.org/10.1130/0091-7613(1988)016<0848:OTROII>2.3.CO;2.
- Whitehead, J.A., 1988, Fluid models of geological hotspots: Annual Review of Fluid Mechanics, v. 20, p. 61–87, https://doi.org/10.1146/annurev.fl.20.010188.000425.
- Whitney, D.L., Teyssier, C., and Vanderhaeghe, O., 2004, Gneiss domes and crustal flow, in Whitney, D.L., Teyssier, C., and Siddoway, C.S., eds., Gneiss Domes in Orogeny: Geological
- Society of America Special Paper 380, p. 15–33, https://doi.org/10.1130/0-8137-2380-9.15.
- Whitney, D.L., Teyssier, C., Rey, P., and Buck, W.R., 2013, Continental and oceanic core complexes: Geological Society of America Bulletin, v. 125, p. 273–298, https://doi.org/10.1130/B30754.1.
- Wright, J.E., and Snoke, A.W., 1993, Tertiary magmatism and mylonitization in the Ruby-East Humboldt metamorphic core complex, northeastern Nevada: U-Pb geochronology and Sr, Nd, and Pb isotope geochemistry: Geological Society of America Bulletin, v. 105, p. 935–952, https://doi.org/10.1130/0016-7606(1993)105<0935:TMAMIT>2.3.CO;2.
- Yin, A., 1991, Mechanisms for the formation of domal and basinal detachment faults: A three-dimensional analysis: Journal of Geophysical Research. Solid Earth, v. 96, p. 14,577–14,594, https://doi.org/10.1029/91JB01113.
- Yin, A., 2004, Gneiss domes and gneiss dome systems, in Whitney, D.L., Teyssier, C., and Siddoway, C.S., eds., Gneiss Domes in Orogeny: Geological Society of America Special Paper 380, p. 1–14, https://doi.org/10.1130/0-8137-2380-9.1.
- Yonkee, W.A., and Weil, A.B., 2015, Tectonic evolution of the Sevier and Laramide belts within the North American Cordillera orogenic system: Earth-Science Reviews, v. 150, p. 531–593, https://doi.org/10.1016/j.earscirev.2015.08.001.
- Zuza, A.V., Henry, C.D., Dee, S., Thorman, C.H., and Heizler, M.T., 2021, Jurassic–Cenozoic tectonics of the Pequop Mountains, NE Nevada, in the North American Cordillera hinterland: Geosphere, v. 17, p. 2078–2122, https://doi.org/10.1130/GES02307.1.
- Zuza, A.V., Levy, D.A., Dee, S., DesOrmeau, J.W., Cheng, F., and Li, X., 2022, Structural architecture and attenuation of the ductile lower plate of the Ruby Mountain-East Humboldt Range metamorphic core complex, northeast Nevada: Tectonics, v. 41, no. 8, https://doi.org/10.1029/2021TC007162.
