
In this article
Authors
Anjana K. Shah*
U.S. Geological Survey, DFC MS 973, P.O. Box 25046, Denver, Colorado 80225, USA, ashah@usgs.gov, ORCID: https://orcid.org/0000-0002-3198-081X
Robert H. Morrow IV
South Carolina Dept. of Natural Resources Geological Survey, 5 Geology Road, Columbia, South Carolina 29212, USA, morrowr@dnr.sc.gov, ORCID: https://orcid.org/0000-0001-5282-2389
Michael D. Pace
U.S. Geological Survey, DFC MS 973, P.O. Box 25046, Denver, Colorado 80225, USA, mpace@usgs.gov, ORCID: https://orcid.org/0000-0003-2770-5724
M. Scott Harris
202 Calhoun Street, College of Charleston, Charleston, South Carolina 29412, USA, harriss@cofc.edu, ORCID: https://orcid.org/0000-0002-9220-788X
William R. Doar III
South Carolina Dept. of Natural Resources Geological Survey, 217 Ft. Johnson Road, Columbia, South Carolina 29412, USA, doarw@dnr.sc.gov, ORCID: https://orcid.org/0000-0002-9895-8422
Abstract
Critical mineral resources titanium, zirconium, and rare earth elements occur in placer deposits over vast parts of the U.S. Atlantic Coastal Plain. Key questions regarding provenance, pathways of minerals to deposit sites, and relations to geologic features remain unexplained. As part of a national effort to collect data over regions prospective for critical minerals, the first public high-resolution aeroradiometric survey over the U.S. Atlantic Coastal Plain was conducted over Quaternary sediments in South Carolina. The new data provide an unprecedented view of potential deposits by imaging Th-bearing minerals in the heavy mineral assemblage. Sand ridges show the highest radiometric Th values with localized, linear anomalies, especially along the shoreface and in areas reworked by multiple processes and/or during multiple episodes. Estuarine areas with finer-grained sediments show lower, distributed Th anomalies. Th values averaged over geologic unit areas are similar for both environments, suggesting that heavy minerals are present but have not been locally concentrated in the lower-energy estuarine environments. Radiometric K highlights immature minerals such as mica and potassium feldspar. K is elevated within shallow sediments younger than ca. 130 ka, an attribute that persists in regional data from northern South Carolina to northern Florida. Both K and Th are elevated over the floodplains of the Santee River and other rivers with headwaters in the igneous and metamorphic Piedmont Terrane. The persistence of K anomalies for distances of more than 100 km from the Santee River floodplain suggests that heavy minerals are delivered from the Piedmont to offshore areas by major rivers, transported along the coast by the longshore current, and redeposited onshore by marine processes.
*Corresponding author.
Manuscript received 26 Apr. 2021. Revised manuscript received 26 July 2021. Manuscript accepted 1 Aug. 2021. Posted 8 Sept. 2021.
© The Geological Society of America, 2021. CC-BY-NC.
https://doi.org/10.1130/GSATG512A.1
Introduction
Technologies ranging from advanced electronics to renewable energy and medical devices depend increasingly on minerals considered “critical”; i.e., materials that are essential for the economy and its functions, but for which there is a risk of supply disruption (National Research Council, 2008; McCullough and Nassar, 2017; Schulz et al., 2017). The need for better knowledge of domestic critical mineral resources has resulted in funding for data collection over areas prospective for critical mineral deposits, including 19 new airborne magnetic-radiometric surveys contracted through the U.S. Geological Survey since 2019 (Day et al., 2019; Earth MRI Acquisitions Viewer: https://ngmdb.usgs.gov/emri/#3/, accessed Feb. 2021). These new data are helping researchers address basic questions about critical mineral deposits such as ore genesis processes and exploration approaches; they can also have applications to other fields. As part of a multidisciplinary effort addressing mineral resource and earthquake hazard studies, an airborne radiometric and magnetic survey was flown over Lower Coastal Plain sediments near Charleston, South Carolina, USA, in 2019. The targets were potential critical mineral placer deposits and subsurface faults of the Charleston seismic zone (Shah, 2020).
Placer deposits containing critical minerals titanium (Ti; used for aircraft, medical devices, and pigments), zirconium (Zr; used in ceramics, fiber-optic components, and geothermal energy systems), and rare earth elements (REEs; used in batteries, supermagnets, solar and wind energy systems, and other advanced technology) are documented in every continent except Antarctica. They currently supply 68% and 100% of global Ti and Zr, respectively (Jones et al., 2017; Woodruff et al., 2017). Prior to the 1960s they were also a primary source of REEs, but today carbonatite and ion-adsorption clays are generally favored, probably because they involve reduced handling of thorium (Long et al., 2010; Mudd and Jowitt, 2016). Placer deposits have been mined for decades in the U.S. Atlantic Coastal Plain, where the potential resource area is vast, extending from southern New Jersey to northern Florida and Alabama; mining is currently active in Georgia and Florida (Force, 1991; Grosz and Schruben, 1994; Van Gosen et al., 2014; Berquist et al., 2015; Woodruff et al., 2017).
Also referred to as heavy-mineral sand deposits, placer deposits form when water and wind concentrate unconsolidated sediments according to density, size, and shape. Minerals such as ilmenite and rutile (containing Ti), monazite and xenotime (containing REEs), and zircon (containing Zr) are relatively dense and typically become co-located when sediments are sorted through the reworking and winnowing of less dense grains (Force, 1991). This dependence on physical processes makes mining and remediation relatively simple: mineral separation is conducted using density, magnetic, or electrical methods, allowing waste, which consists primarily of lighter sands such as quartz, to be safely returned to mine pits (Van Gosen et al., 2014).
Several studies have shown that radiometric methods can directly image shallow Ti-Zr-REE–heavy mineral sand concentrations due to the natural radioactivity of monazite, an REE-phosphate mineral containing small amounts of Th and U (Mahdavi, 1964; Robson and Sampath, 1977). Early airborne surveys used scintillation to measure the total gamma ray count (Force et al., 1982; Grosz, 1983; Mudge and Teakle, 2003). In subsequent years, airborne gamma spectrometry methods were developed, allowing the distinction of signals due to K, Th, and U (International Atomic Energy Agency, 2003; Duval et al., 2005). In most of the United States, gamma spectrometry surveys are currently limited by coarse line spacing (1.6–10 km) but do show broad regions in the southeastern U.S. where Ti-Zr-REE deposits are prospective (Grosz et al., 1989; Shah et al., 2017).
The 2019 South Carolina survey, flown with modern equipment and 400-m flight line spacing, represents the first high-resolution public aeroradiometric survey over U.S. Atlantic Coastal Plain sediments. Coverage over 12,000 km2 with a footprint of 100–200 m provides data1 at a scale not feasible through drilling campaigns. The survey allows new, basic questions regarding the following to be addressed: (1) the geologic and geomorphologic features associated with placer deposits; (2) the corresponding geologic controls on formation; and (3) the provenance, dominant delivery pathways, and impacts on composition of the heavy mineral assemblage.
-------
1Supplemental Material. Item S1: Listing and index of geologic maps used in images and statistical analyses with age correlations for different map unit definitions. Item S2: Visual heavy mineral sand and phosphate content for over 1000 auger samples collected during previous mapping efforts. Item S3: Heavy mineral sand weight percent and economic mineral grade and tonnage estimates by Force et al. (1982) with overlays of sample positions on the new data. Item S4: Radiometric eTh, eU, and K draped over lidar (three PDF files). Go to https://doi.org/10.1130/GSAT.S.15152298 to access the supplemental material; contact editing@geosociety.org with any questions.
Geologic Background
The Lower Coastal Plain of South Carolina (Fig. 1) comprises gentle, elongate sand ridges alternating with low-lying clay and mud-filled areas that formed in response to a series of Quaternary transgressions and regressions; these are punctuated by various river systems (Cooke, 1936; Colquhoun, 1969; Doar and Kendall, 2014). Within the survey area, detailed geologic mapping and geochronological studies (see footnote 1, item S1) defined a series of Quaternary alloformations that lie unconformably upon Neogene and Paleogene sediments. Most rivers in the study area drain from upland areas within the Atlantic Coastal Plain. The primary exception is the Santee River, with headwaters originating in the Piedmont and traversing metamorphic and igneous terranes for more than 100 km. The wide floodplain of the Santee River is now exposed downriver of the 1941 Santee dam.
Figure 1
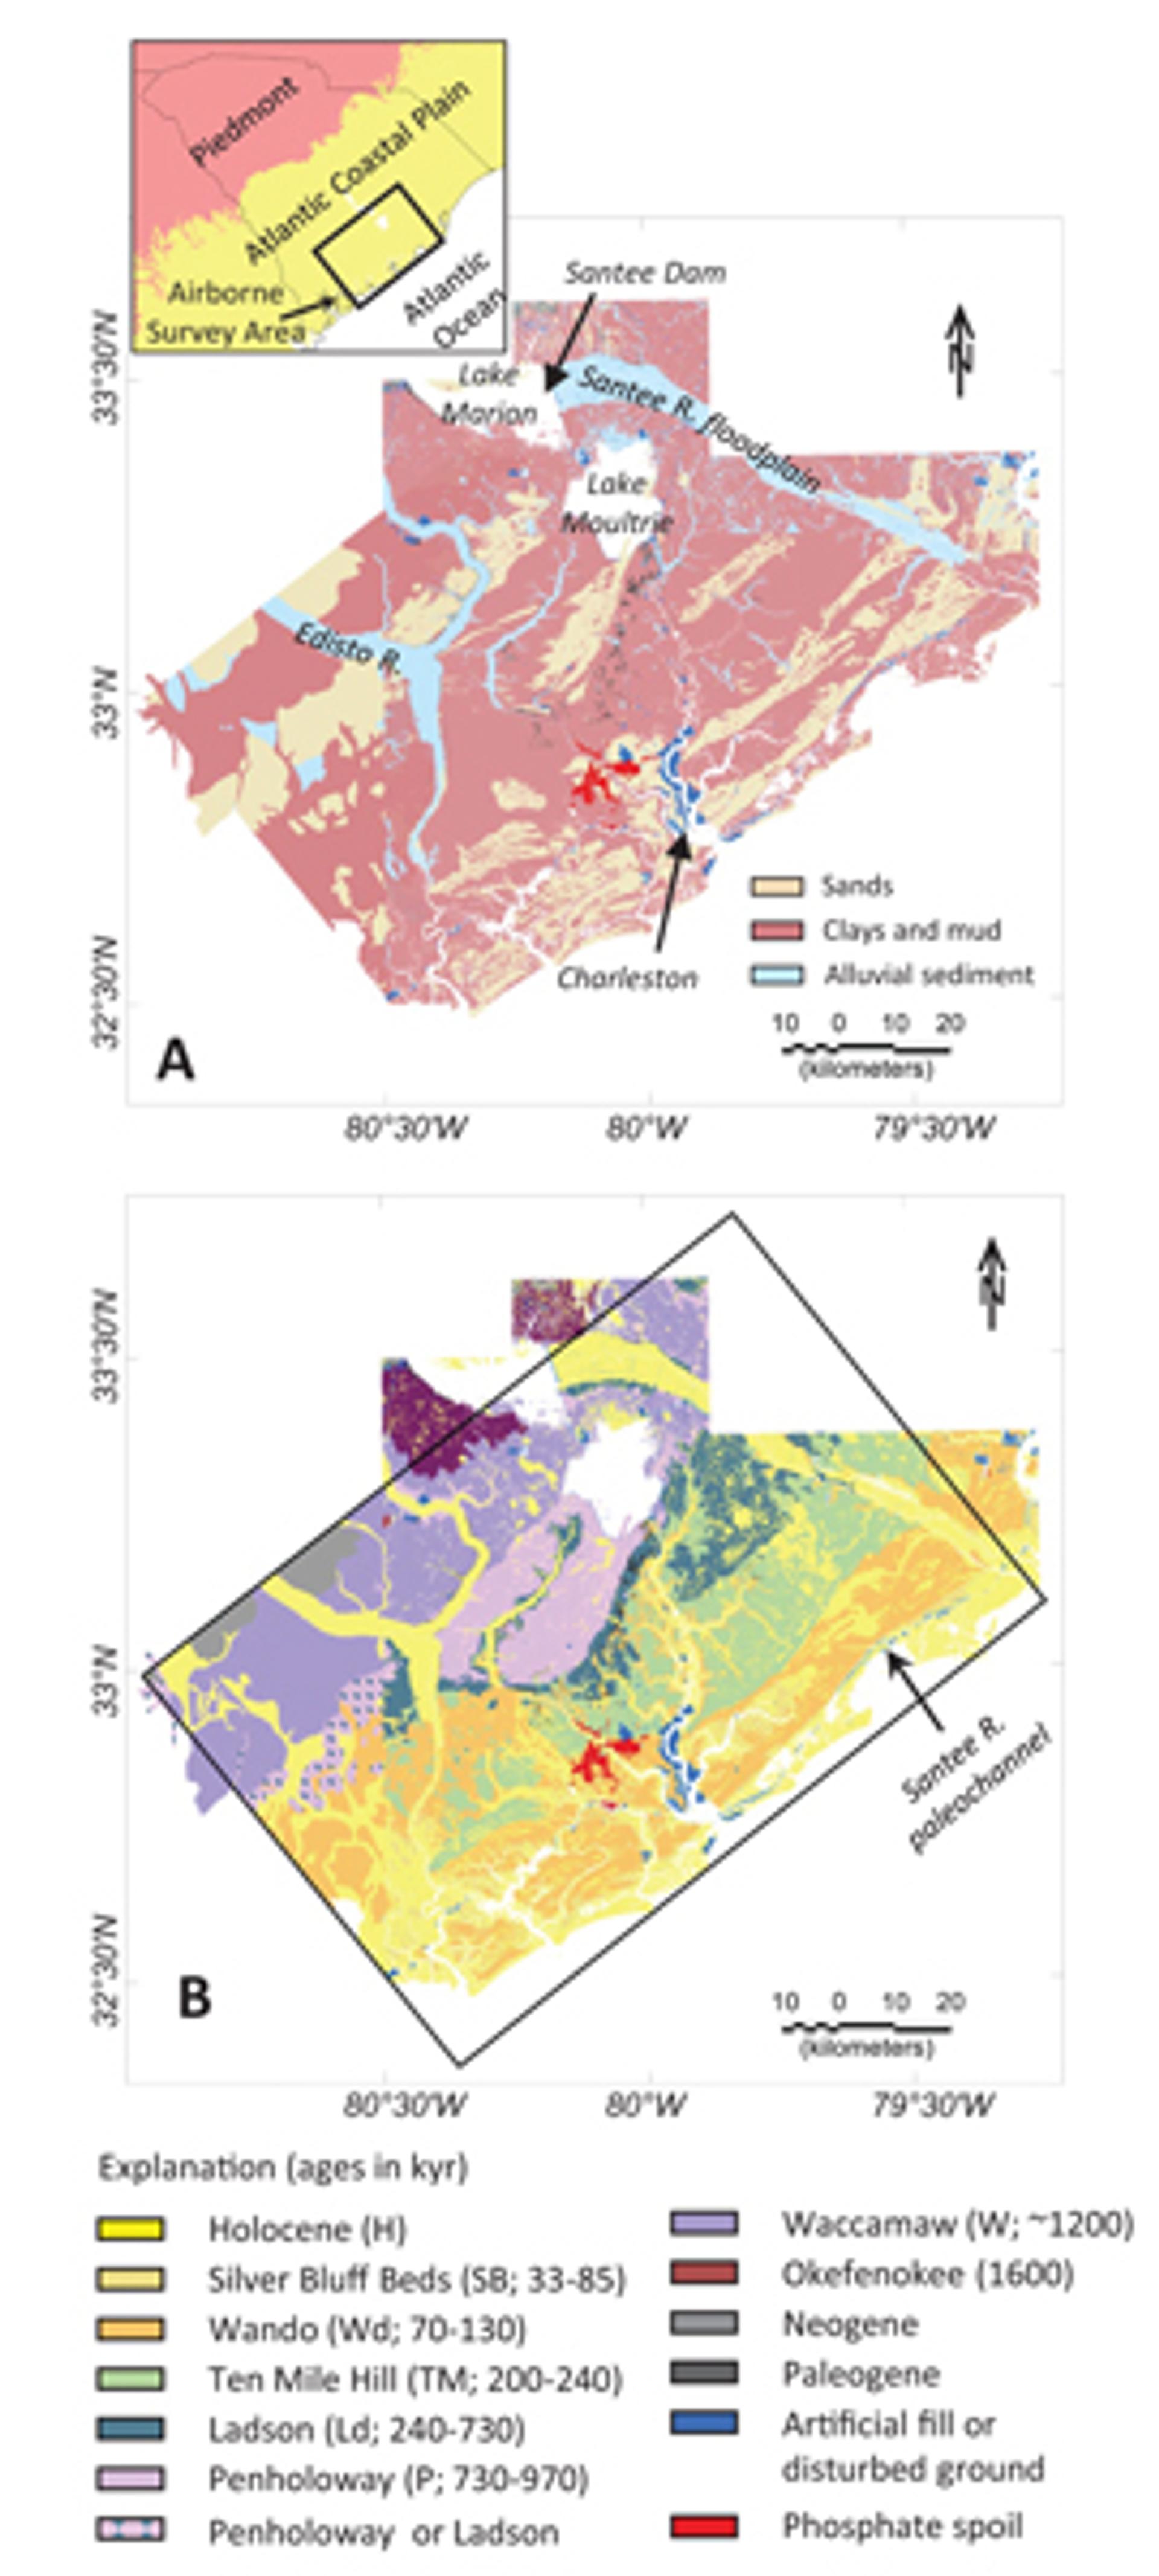
Generalized geology of the survey area (see text footnote 1, item S1) distinguished by facies (A) and alloformation (B).
Heavy mineral sands, eroded from the neighboring metamorphic and igneous Piedmont Province, have been observed throughout the study area via auger samples collected by R. Weems, E. Force, and others (see footnote 1, items S2 and S3). These studies found heavy mineral concentrations from 0% to more than 25% in layers up to several meters thick within Quaternary sediments. They contain ilmenite, epidote, and sillimanite with smaller amounts of rutile, monazite, leucoxene, and other minerals.
Aeroradioactivity total count surveys were flown in the study area with 1.6-km line spacing during the 1960s and early 1970s. Using these data to guide ground gamma spectrometry measurements and sample mineralogical analyses, Force et al. (1982) found direct correlations between radiometric Th and heavy mineral concentrations, attributable to Th in monazite. Radiometric K correlated well with potassium feldspars and micas, which are considered immature because leaching of potassium typically leads to alteration. They estimated grades of economic Ti-Zr-REE minerals as high as 2% and tonnage up to 70,000 metric tons at some locales (see footnote 1, item S3). They also found the mineralogy varies locally, and some heavy mineral concentrations contained large amounts of immature minerals with little economic value.
Methods
The 2019 airborne magnetic and radiometric data were collected over a 134 km × 90 km area surrounding the city of Charleston, South Carolina, by contract for the U.S. Geological Survey (Figs. 2–4). This method provides statistical estimates of K, Th, and U concentrations within the upper 1 m of the surface and several hundred meters in each horizontal direction (International Atomic Energy Agency, 2003). Th and U involve multiple decay series, so measurements are typically referred to as equivalent uranium (eU) and thorium (eTh). The surveys were flown along NW-SE traverses at a nominal height of 100 m above ground, although areas above the city of Charleston were flown at >300 m above ground as per safety regulations. Data and details regarding contractor processing are provided by Shah (2020).
Figure 2
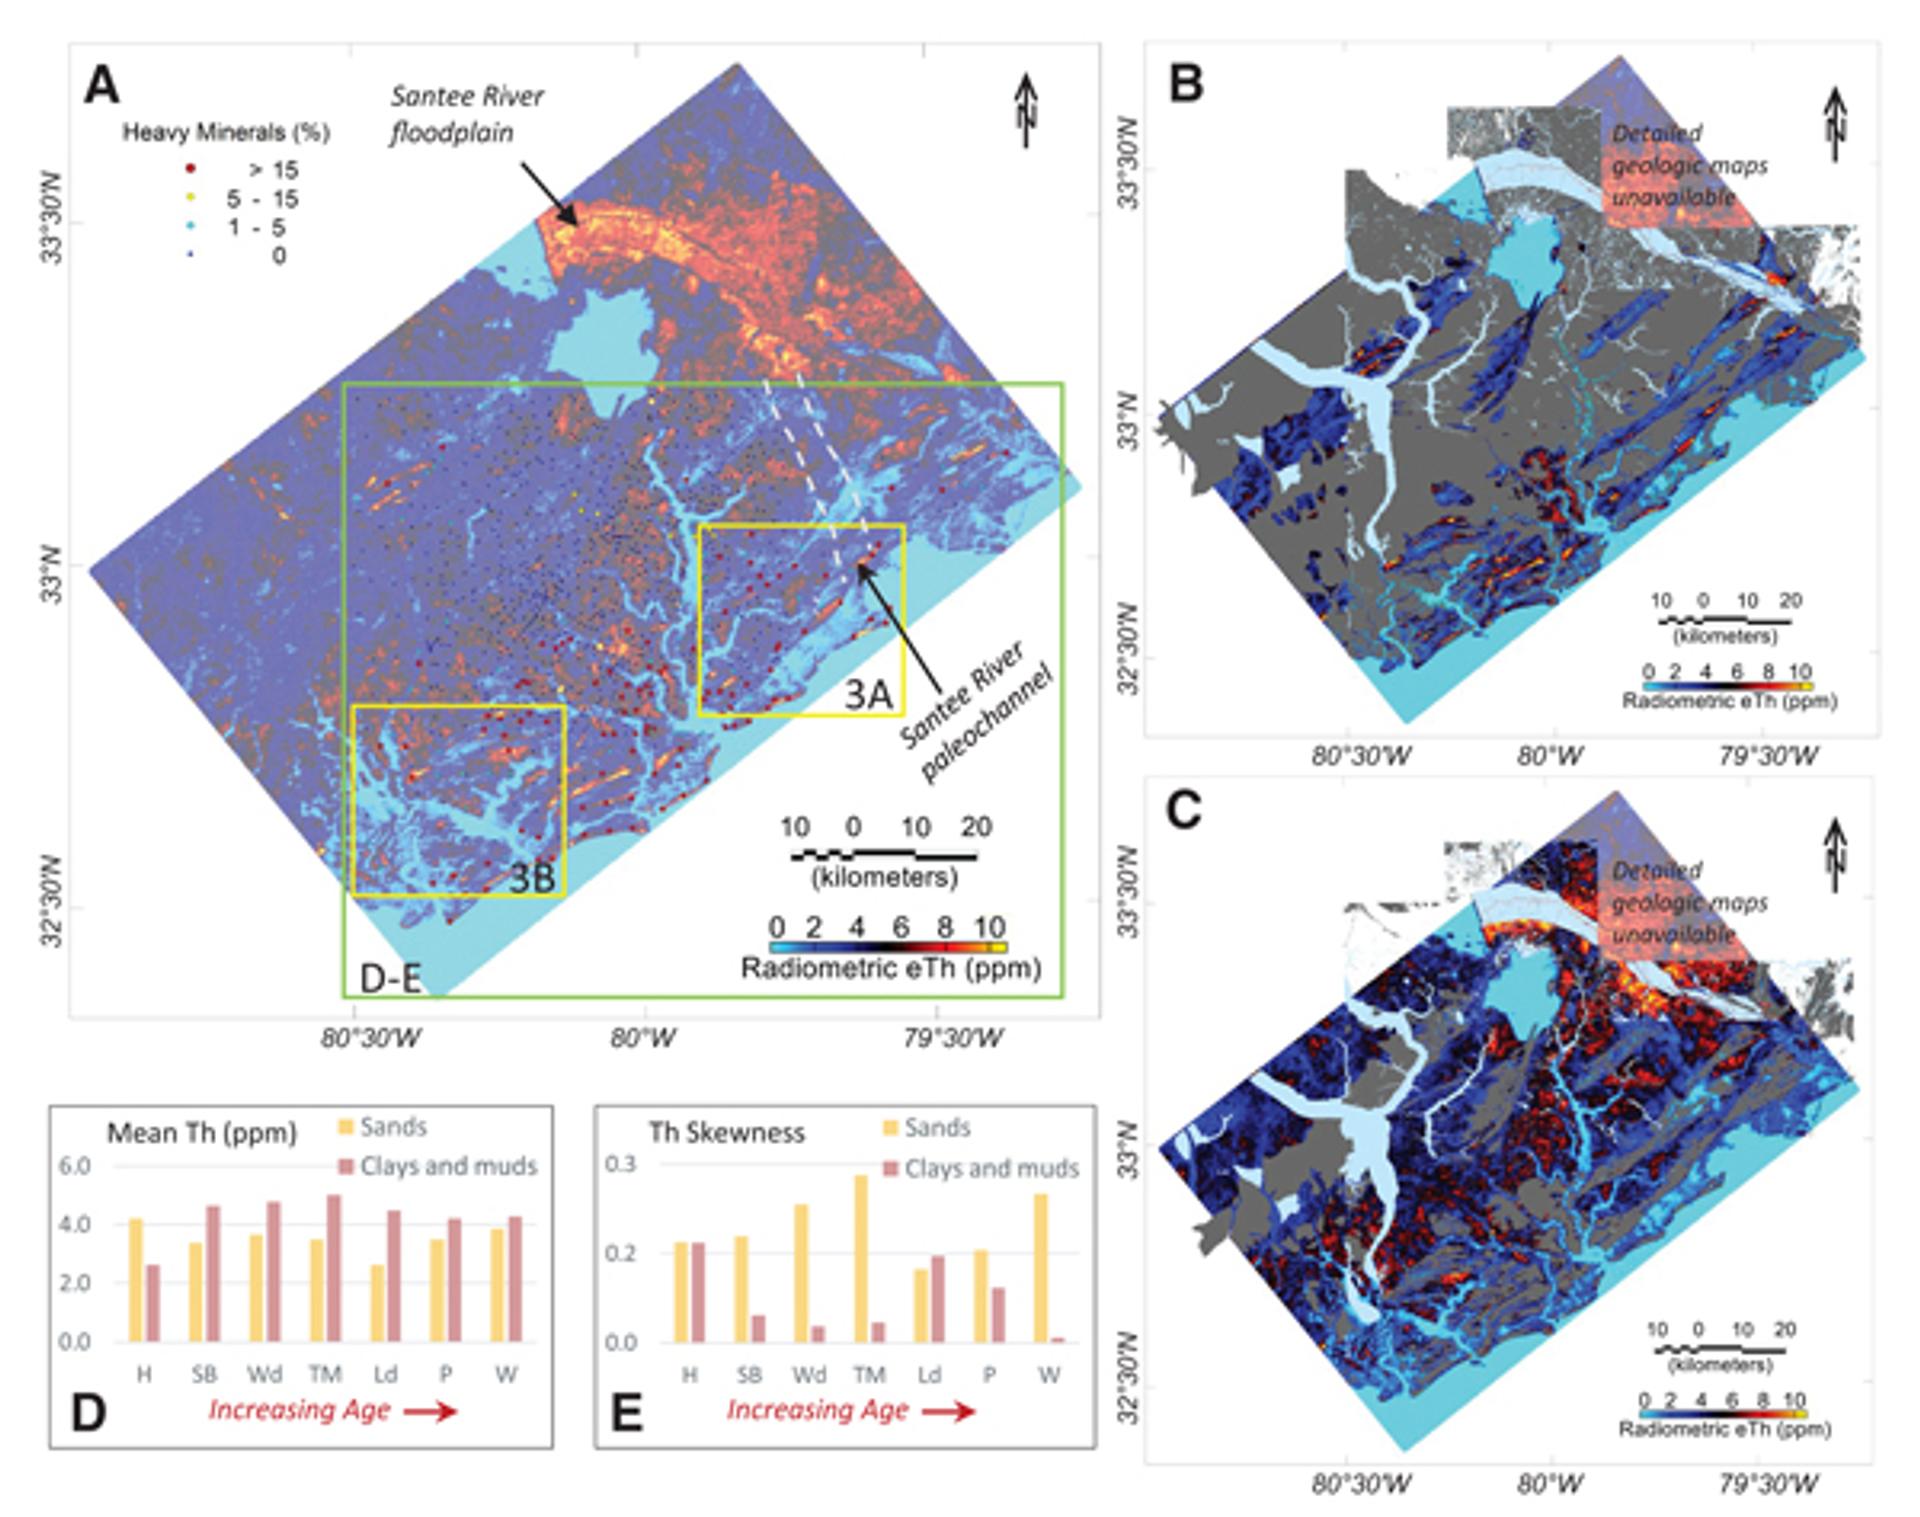
(A) Airborne eTh over the 2019 survey area and approximate heavy mineral percentages (circles) from visual observations of auger samples (see text footnote 1, item S2); green box shows area used for statistical calculations (D and E); yellow boxes show locations of close-ups in Figure 3. Gray dashed lines show the location of a buried paleochannel. (B–C) Airborne eTh for sands only (B) and clays/muds only (C). (D) Mean and (E) skewness values of eTh (parts per million [ppm]) for the various geologic units. H—Holocene; SB—Silver Bluff Beds; Wd—Wando; TM—Ten Mile Hill; Ld—Ladson; P—Penholoway; W—Waccamaw.
Figure 3
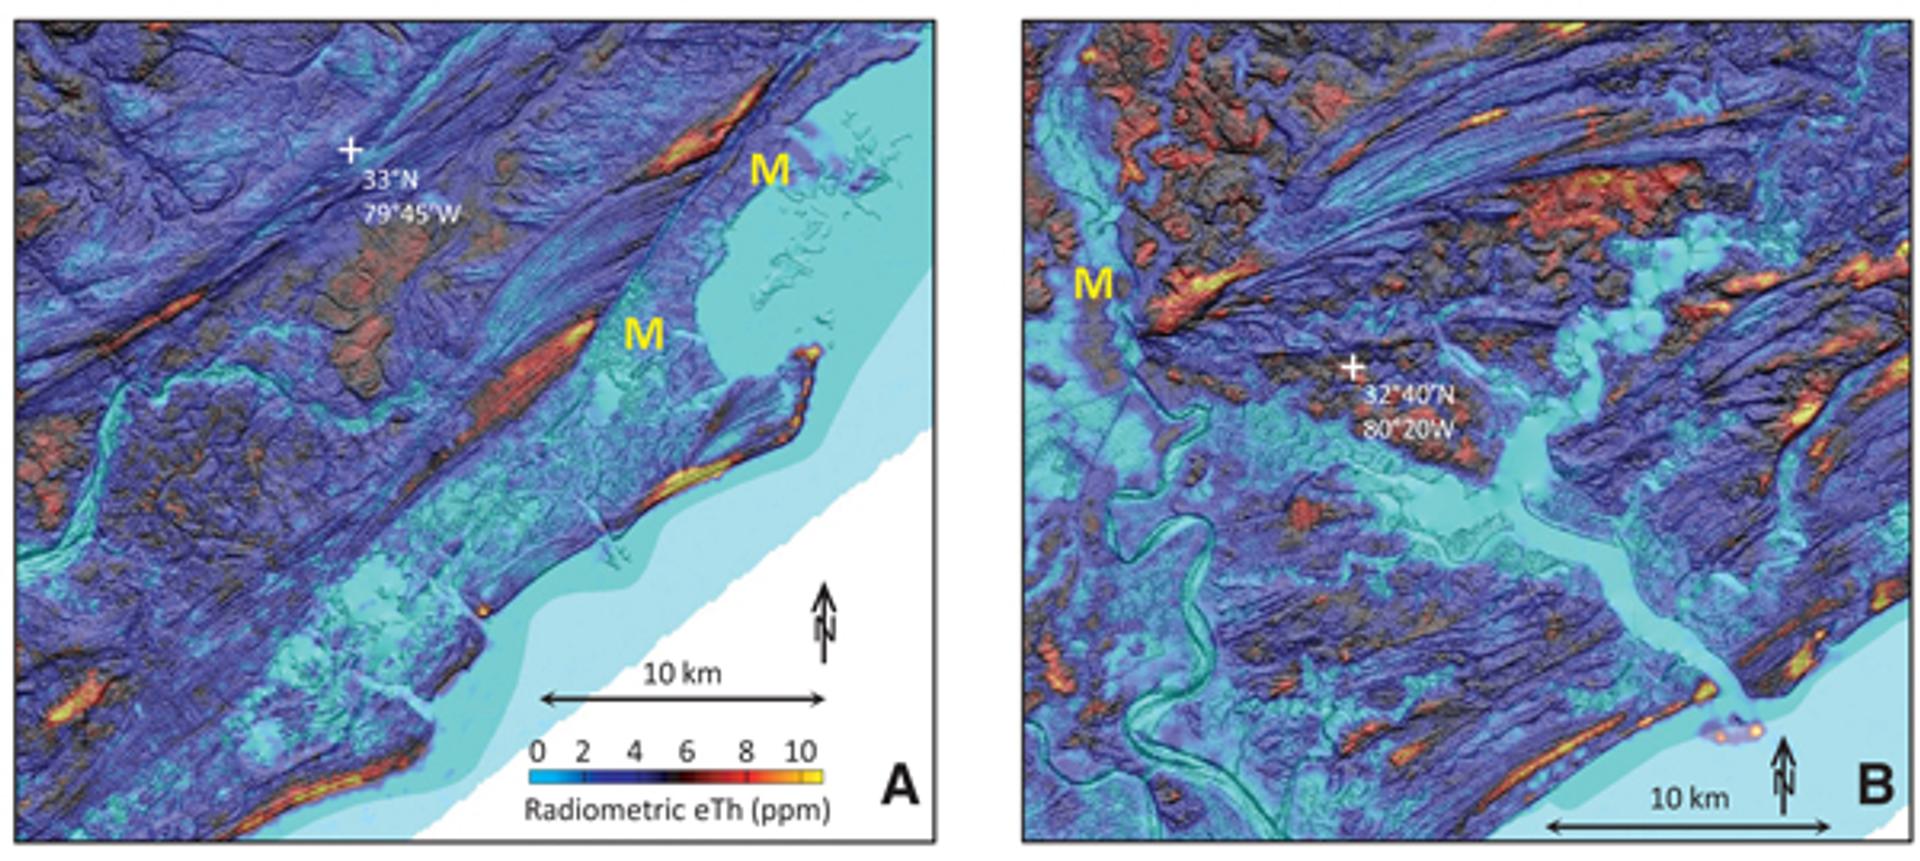
Close-ups of eTh draped over a lidar elevation shaded relief map (see text footnote 1, item S4) north (A) and south (B) of Charleston. eTh highs are often located along the shoreface and near streams or inlets. Highest values occur near areas marked “M” that experienced multiple episodes of reworking by marine processes.
Figure 4
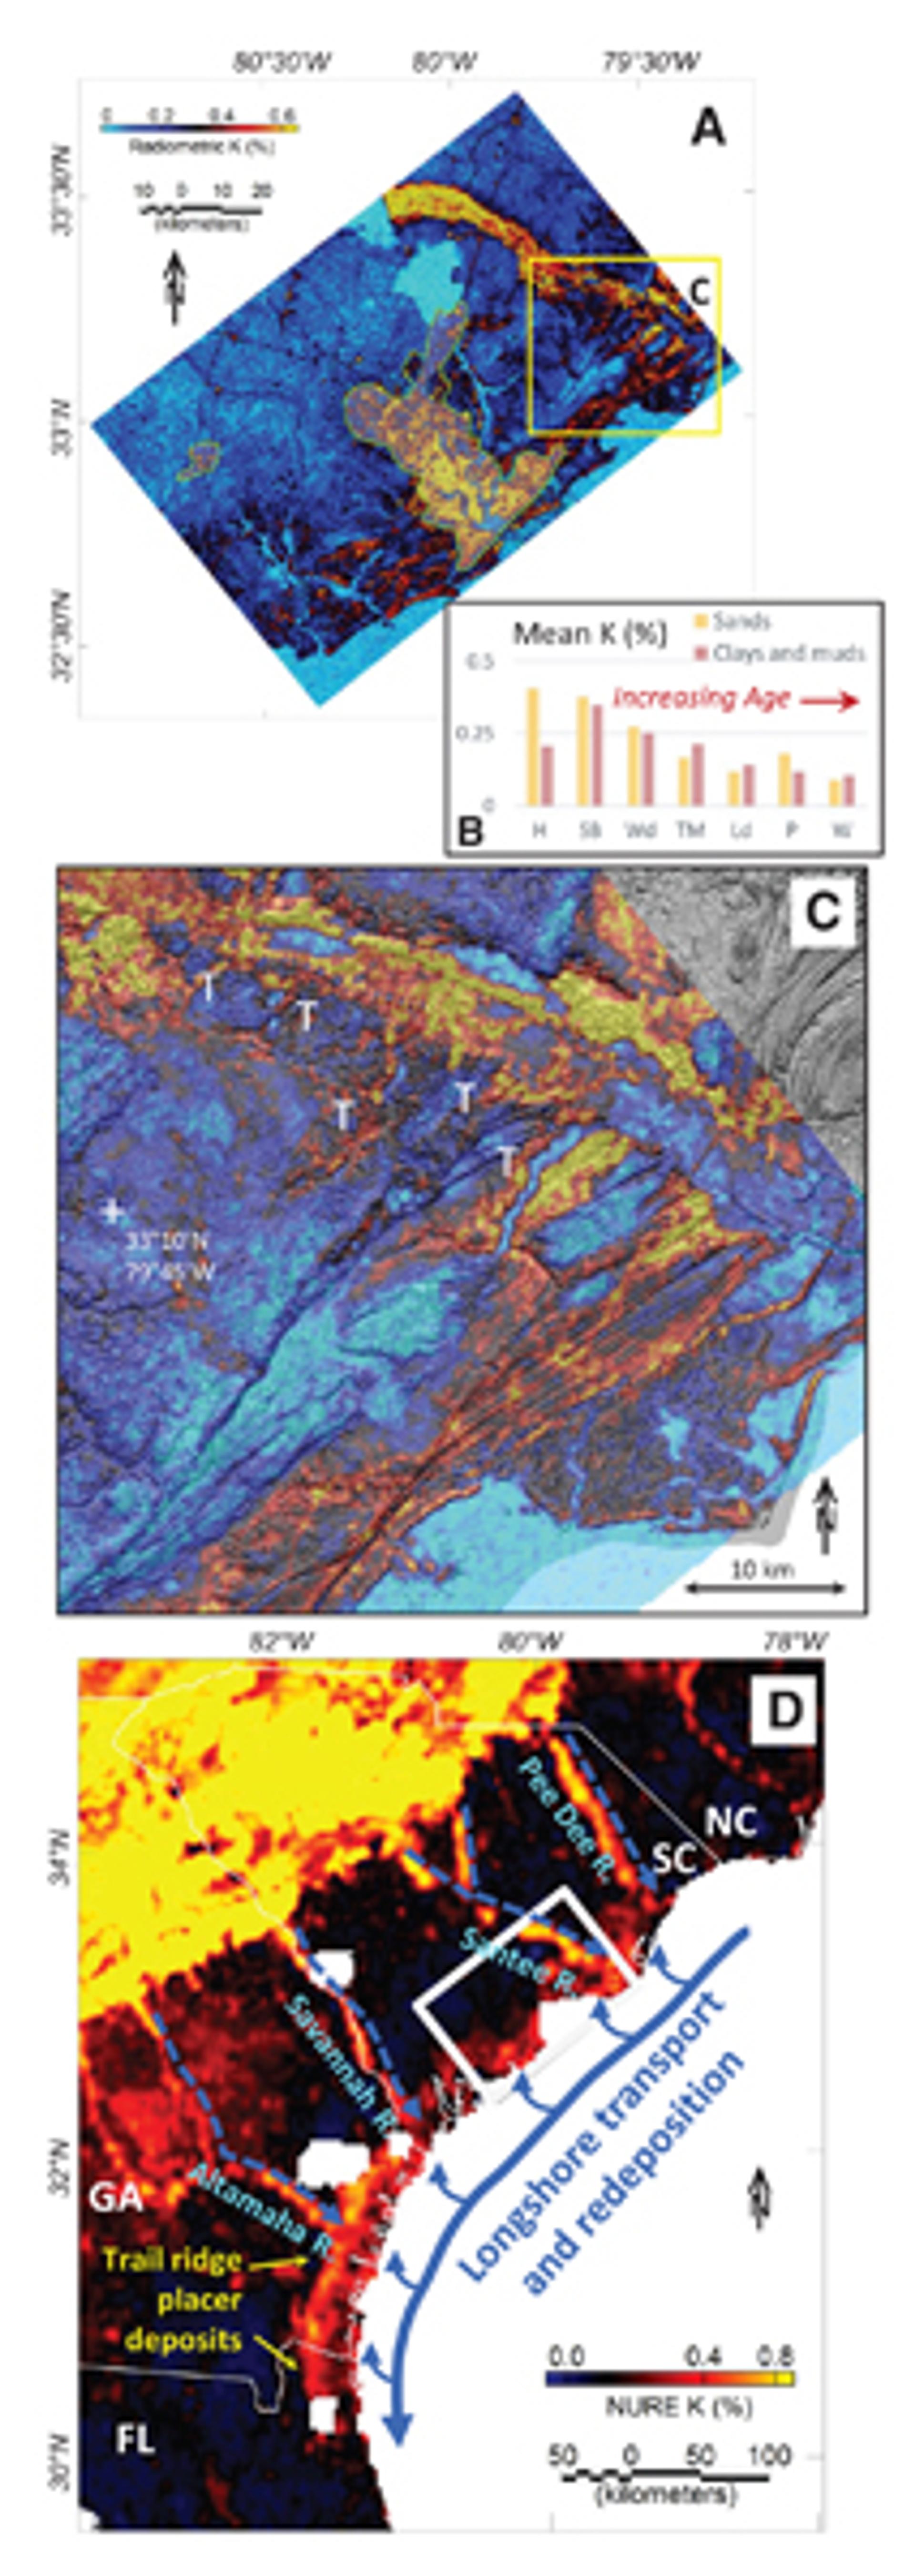
(A) Airborne K over the 2019 survey area. Shaded area with green outline delineates urban areas; yellow box shows location of close-up draped over lidar near the Santee River floodplain (C), where highs along tributaries are observed only up to ~15 km from the floodplain (“T”). (B) Mean value of K (%) for the various units. (D) Regional radiometric K over the Lower Coastal Plain of the southeastern U.S. (Duval et al., 2005). White box shows the location of the 2019 survey area. Potassium is elevated for younger sediments. Arrows show the suggested path of heavy minerals along major rivers to offshore areas, transported parallel to the coast, and then redeposited onshore. H—Holocene; SB—Silver Bluff Beds; Wd—Wando; TM—Ten Mile Hill; Ld—Ladson; P—Penholoway; W—Waccamaw; NC—North Carolina; SC—South Carolina; GA—Georgia; FL—Florida.
Previous geologic maps (see footnote 1, item S1) (Fig. 1) were used to calculate basic statistical measures (mean, median, standard deviation, and skewness) for K and eTh over the total area of various geologic alloformations and sediment facies. For consistency between map units, we restricted the statistical calculations to the subset of the survey area mapped by Weems et al. (2014). Lidar elevation shaded relief maps (South Carolina lidar data: https://www.dnr.sc.gov/GIS/lidar.html, accessed Feb. 2020) were used to examine the geomorphologic context of the airborne data. For ground truth, we used previously published visual estimates of heavy mineral content from more than 1000 auger samples (see footnote 1, item S2) and detailed mineralogical analyses on several dozen samples collected over high total count anomalies, including weight percent heavy minerals and mineralogy (see footnote 1, item S3).
Results
Thorium
Radiometric eTh shows a reasonable correspondence with previous observations of heavy minerals in shallow samples up to variability within the resolution of the airborne survey footprint (Fig. 2A). Comparisons to sample data (see footnote 1, items S2 and S3) support heavy mineral sand concentrations near the surface as the primary source of radiometric Th anomalies. The anomalies are highest over 3–12-km-long and 400–1200-m-wide portions of sand ridges (Fig. 2B), similar to some of the shoreline deposits located near the actively mined Trail Ridge/Folkston system in Georgia and Florida (Pirkle et al., 2013). These anomalies contrast broader, rounded, and lower anomalies over clay/mud estuarine areas (Fig. 2C). Statistical measures (Figs. 2D–2E) mostly show higher eTh skewness values for sands even though the mean values for sands and clays/muds are similar. Holocene clays, which are subject to tidal flooding, show lower values because gamma rays are attenuated by the fluid medium.
Drapes over lidar elevation data (Fig. 3) show the eTh values are generally higher along the shoreface and lower along the backbarrier, similar to deposits mapped via sampling in Georgia, Florida, and eastern Australia (Roy, 1999; Pirkle et al., 2013). The highest eTh values occur mainly near the tips of the barrier islands at inlets where tidal activity is increased and near cross-cutting features visible in lidar data that suggest multiple episodes of sand reworking (marked in Fig. 3).
High eTh values are also observed over the width of the upper Santee River floodplain and immediately to the north, where a mix of terrace, eolian, and marine sediments has been observed. In the lower Santee River floodplain, eTh anomalies are focused along eolian sand ridges. The transition between these different anomaly styles occurs near the head of an Illinoian (>130 ka) paleochannel (Colquhoun et al., 1972), along which a broad eTh low is present (Fig. 2A).
Potassium
The radiometric K map (Fig. 4A) is dominated by highs over the Charleston metropolitan area, smaller towns, and along major roads, attributed to K-rich materials in concrete. High K values are also observed over the Santee River floodplain and along Holocene distributary channels up to 15 km from the floodplain (Fig. 4C). Elevated K over the Santee floodplain are consistent with previous observations of potassium feldspar or mica (Force et al., 1982).
Radiometric K is also elevated for surficial/shallow sediments that are younger than ca. 130 ka, and mean values of K within the study area (Fig. 4B) steadily decrease with age (except for Holocene clays). This is not a local phenomenon: Regional radiometric data (Duval et al., 2005) show elevated K for most sediments within 20–50 km of the coast from northern South Carolina near the Pee Dee River mouth to northern Florida (Fig. 4D) and for other rivers with headwaters in the Piedmont. In the survey area, K highs over younger sediments are discontinuous with those over the Santee River floodplain and are not focused near the Santee River.
Discussion
The Distribution of Heavy Minerals
The new airborne radiometric data provide an unprecedented view of geochemical variations within the Quaternary Atlantic Coastal Plain, with elevated eTh highlighting concentrations of heavy mineral sands. An interpretation of highest-grade heavy minerals residing primarily in sands along the shoreface, especially in areas that have been reworked during multiple episodes or by multiple processes, matches observations based on extensive sampling within the Quaternary coastal plain settings of Australia and the U.S. (Roy, 1999; Pirkle et al., 2013). For most finer-grained estuarine sediments, similar average eTh values combined with lower skewness values suggest that heavy minerals are present but dispersed over broad areas with lower local concentrations. These differences are attributed to greater reworking by waves and fluvial, tidal, or marine currents in the higher-energy, sand-dominated environments.
Mineral Pathways and Provenance
The mineralogy of the heavy mineral assemblage can provide key insights into sedimentary provenance. The importance of erosion and transport by fluvial processes to coastal locales was recognized by Colquhoun et al. (1972) and Neiheisel (1976), who observed immature minerals in the lower Santee River and other floodplains that must have been recently eroded from the Piedmont. However, away from major rivers, heavy mineral concentrations less than ~50 km from the Piedmont Province show mineralogy similar to the adjacent Piedmont rock, attributed to marine processes eroding a rocky coast following opening of the Atlantic Ocean (Shah et al., 2017). This study also showed that heavy mineral concentrations closer to the modern coast have more varied compositions and thus more complex delivery pathways, with specific source regions poorly known.
The presence of elevated K, representing immature minerals (Force et al., 1982), requires sediments that were recently eroded from igneous and/or metamorphic rocks in the Piedmont. The most likely transport mechanism from the Piedmont to the coast is via major rivers such as the Santee, consistent with high K anomalies observed over its floodplain. However, prominent K anomalies are also observed more than 100 km from the floodplain, requiring additional transport. The few distributary channels from the Santee River showing elevated K are less than 15 km long, making them an unlikely transport route. Additionally, the high K values over marine sediments are discontinuous with those in the Santee River floodplain.
The persistence of K-rich sediments more than 100 km from major rivers requires a mode of transport that only exists offshore. Heavy minerals were most likely delivered from the Piedmont to offshore areas by the Santee and other major rivers, transported by longshore currents during transgressions or regressions, and then redeposited onshore by currents and waves. This appears to be a regional phenomenon, because similar anomalies are present over younger sediments from northern South Carolina to northern Florida and the Pee Dee, Savannah, and Altamaha Rivers (Fig. 4D).
The transport of heavy minerals a long distance from a river source contrasts the simpler scenario suggested for sediments adjacent to the Piedmont, where heavy minerals are mostly deposited adjacent to the rocks from which they were eroded. This contrast poses an interesting question for future research: Where in the Atlantic Coastal Plain is the transition between these different modes of emplacement? Further studies using mineralogical and geochronological approaches could help to elucidate this question.
Implications for Exploration
High-resolution airborne radiometric data can provide excellent targets for exploration via drilling, with Th highlighting areas with heavy mineral sand concentrations and K highlighting areas with immature sediments. Targeted approaches based on high-resolution data can in turn facilitate more accurate assessments, with fewer samples collected in areas peripheral to the deposit (potentially leading to underestimates [see footnote 1, item S3]).
Perhaps the most interesting implications, however, involve an improved understanding of associated geologic processes at scales of hundreds of meters to hundreds of kilometers. Using relations to geomorphologic features can help to focus exploration efforts. Sediment pathways and provenance provide key information about the heavy mineral assemblage and whether economic minerals may be present. For example, the strong impact of fluvial processes proposed here suggests that Quaternary deposits, including the heavily mined Trail Ridge and Folkston deposits in Georgia and Florida, can involve a greater diversity of dense minerals.
Conclusions
High-resolution airborne radiometric data provide a powerful way to image areas prospective for critical mineral placer deposits over large regions. They can provide insights into relations to specific geomorphologic features, transport pathways, and provenance. In the survey area, they highlight the importance of not only marine and tidal processes in concentrating sediments, but also transport for hundreds of kilometers by rivers and longshore currents. These results have implications not only for exploration but also for further developing our understanding of the broader geologic processes associated with these important deposits.
Acknowledgments
The airborne surveys were funded as a collaborative effort by the U.S. Geological Survey Earthquake Hazards Program, National Cooperative Geologic Mapping Program, Mineral Resources Program, and Earth Mapping Resources Initiative. The data were collected and processed by Terraquest Ltd. We thank Bradley Van Gosen and two anonymous reviewers for helpful reviews. Any use of trade, firm, or product names is for descriptive purposes only and does not imply endorsement by the U.S. government.
References
- Berquist, C.R., Shah, A.K., and Karst, A., 2015, Placer deposits of the Atlantic Coastal Plain: Stratigraphy, sedimentology, mineral resources, mining and reclamation, Cove Point, Maryland, Williamsburg and Stony Creek, Virginia: Society of Economic Geologists Guidebook 50, 48 p.
- Colquhoun, D.J., 1969, Geomorphology of the lower coastal plain of South Carolina: South Carolina State Development Board, Publication MS-5, 36 p.
- Colquhoun, D.J., Bond, T.A., and Chappel, D., 1972, Santee submergence, example of cyclic submerged and emerged sequences, in Nelson, B.W., ed., Environmental Framework of Coastal Plain Estuaries: Geological Society of America Memoir 133, p. 475–496, https://doi.org/10.1130/MEM133-p475.
- Cooke, C.W., 1936, Geology of the coastal plain of South Carolina: U.S. Geological Survey Bulletin 867, 196 p.
- Day, W.C., Drenth, B.J., McCafferty, A.E., Shah, A.K., Ponce, D.A., Jones, J.V., III, and Grauch, V.J.S., 2019, The U.S. Geological Survey’s Earth Mapping Resources Initiative (Earth MRI)—Providing framework geologic, geophysical, and elevation data for the Nation’s critical mineral-bearing regions: Fasttimes, v. 24, p. 55–61.
- Doar, W.R., III, and Kendall, C.G., 2014, An analysis and comparison of observed Pleistocene South Carolina (USA) shoreline elevations with predicted elevations derived from marine oxygen isotope stages: Quaternary Research, v. 82, no. 1, p. 164–174, https://doi.org/10.1016/j.yqres.2014.04.005.
- Duval, J.S., Carson, J.M., Holman, P.B., and Darnley, A.G., 2005, Terrestrial radioactivity and gamma-ray exposure in the United States and Canada: U.S. Geological Survey Open-File Report 2005-1413, https://pubs.usgs.gov/of/2005/1413/ (accessed 11 Aug. 2021).
- Force, E.R., 1991, Geology of titanium-mineral deposits: Geological Society of America Special Paper 259, 112 p., https://doi.org/10.1130/SPE259-p1.
- Force, E.R., Grosz, A.E., Loferski, P.J., and Maybin, A.H., 1982, Aeroradioactivity Maps in Heavy-Mineral Exploration—Charleston, South Carolina, Area: U.S. Geological Survey Professional Paper 1218, 19 p., 2 plates.
- Grosz, A.E., 1983, Application of total-count aeroradiometric maps to the exploration for heavy-mineral deposits in the coastal plain of Virginia: U.S. Geological Survey Professional Paper 1263, 20 p., 5 plates.
- Grosz, A.E., and Schruben, P.G., 1994, NURE geochemical and geophysical surveys—Defining prospective terranes for United States placer exploration: U.S. Geological Survey Bulletin 2097, 9 p., 2 plates.
- Grosz, A.E., Cathcart, J.B., Macke, D.L., Knapp, M.S., Schmidt, W., and Scott, T.M., 1989, Geologic interpretation of the gamma-ray aeroradiometric maps of central and northern Florida: U.S. Geological Survey Professional Paper 1461, 48 p., 5 plates.
- International Atomic Energy Agency (IAEA), 2003, Guidelines for radioelement mapping using gamma ray spectrometry data: IAEA-TECDOC-1363, International Atomic Energy Agency (IAEA), Vienna.
- Jones, J.V., III, Piatak, N.M., and Bedinger, G.M., 2017, Zirconium and hafnium, in Schulz, K.J., DeYoung, J.H., Jr., Seal, R.R., II, and Bradley, D.C., eds., Critical mineral resources of the United States—Economic and environmental geology and prospects for future supply: U.S. Geological Survey Professional Paper 1802, p. V1–V26, https://doi.org/10.3133/pp1802V.
- Long, K.R., Van Gosen, B.S., Foley, N.K., and Cordier, D., 2010, The principal rare earth elements deposits of the United States—A summary of domestic deposits and a global perspective: U.S. Geological Survey Scientific Investigations Report 2010-5220, 96 p., http://pubs.usgs.gov/sir/2010/5220/, https://doi.org/10.3133/sir20105220.
- Mahdavi, A., 1964, The thorium, uranium, and potassium contents of Atlantic and Gulf Coast beach sands, in Adams, J.A.S., and Lowder, W.M., eds., The natural radiation environment: Chicago, University of Chicago Press (for William Marsh Rice University), p. 87–114.
- McCullough, E., and Nassar, N.T., 2017, Assessment of critical minerals: Updated application of an early-warning screening methodology: Mineral Economics, v. 30, p. 257–272, https://doi.org/10.1007/s13563-017-0119-6.
- Mudd, G.M., and Jowitt, S.M., 2016, Rare earth elements from heavy mineral sands: Assessing the potential of a forgotten resource: Transactions of the Institution of Mining and Metallurgy Section B, Applied Earth Science, v. 125, no. 3, p. 107–113, https://doi.org/10.1080/03717453.2016.1194955.
- Mudge, S., and Teakle, M., 2003, Geophysical exploration for heavy-mineral sands near Mindarie, South Australia: Australian Society of Exploration Geophysicists (ASEG) Extended Abstracts 2003, no. 3, p. 249–255.
- National Research Council, 2008, Minerals, critical minerals, and the U.S. economy: Washington, D.C., The National Academies Press, 246 p., https://doi.org/10.17226/12034.
- Neiheisel, J., 1976, Heavy minerals in aeroradioactive high areas of the Savannah River flood plain and deltaic plain: South Carolina Division of Geology, Geologic Notes, v. 20, no. 2, p. 45–51.
- Pirkle, F.L., Pirkle, W.A., and Rich, F.J., 2013, Heavy-mineral mining in the Atlantic Coastal Plain and what deposit locations tell us about ancient shorelines: Journal of Coastal Research, v. 69, p. 154–175, https://doi.org/10.2112/SI_69_11.
- Robson, D.F., and Sampath, N., 1977, Geophysical response of heavy-mineral sand deposits at Jerusalem Creek, New South Wales: Bureau of Mineral Resources Journal of Australian Geology and Geophysics, v. 2, p. 149–154.
- Roy, P.S., 1999, Heavy mineral beach placers in southeastern Australia: Their nature and genesis: Economic Geology and the Bulletin of the Society of Economic Geologists, v. 94, p. 567–588, https://doi.org/10.2113/gsecongeo.94.4.567.
- Schulz, K.J., DeYoung, J.H., Jr., Seal, R.R., II, and Bradley, D.C., eds., 2017, Critical mineral resources of the United States—Economic and environmental geology and prospects for future supply: U.S. Geological Survey Professional Paper 1802, 797 p., https://doi.org/10.3133/pp1802.
- Shah, A.K., 2020, Airborne magnetic and radiometric survey, Charleston, South Carolina and surrounds, 2019: U.S. Geological Survey data release, https://doi.org/10.5066/P9EWQ08L.
- Shah, A., Bern, C.R., Van Gosen, B.S., Daniels, D.L., Benzel, W.M., Budahn, J.R., Ellefsen, K.J., Karst, A., and Davis, R., 2017, Rare earth mineral potential in the southeastern U.S. Coastal Plain from integrated geophysical, geochemical, and geological approaches: Geological Society of America Bulletin, v. 129, p. 1140–1157, https://doi.org/10.1130/B31481.1.
- Van Gosen, B.S., Fey, D.L., Shah, A.K., Verplanck, P.L., and Hoefen, T.M., 2014, Deposit model for heavy-mineral sands in coastal environments: U.S. Geological Survey Scientific Investigations Report 2010-5070-L, 51 p., http://dx.doi.org/10.3133/sir20105070L.
- Weems, R.E., Lewis, W.C., and Lennon, E.M., Jr., 2014, Surficial geologic map of the Charleston region, Berkeley, Charleston, Colleton, Dorchester, and Georgetown Counties, South Carolina: U.S. Geological Survey Open-File Report 2013-1030, 1 plate, https://doi.org/10.3133/ofr20131030.
- Woodruff, L.G., Bedinger, G.M., and Piatak, N.M., 2017, Titanium, in Schulz, K.J., DeYoung, J.H., Jr., Seal, R.R., II, and Bradley, D.C., eds., Critical Mineral Resources of the United States—Economic and Environmental Geology and Prospects for Future Supply: U.S. Geological Survey Professional Paper 1802, p. T1–T23, https://doi.org/10.3133/pp1802T.
