
Page 7 - i1052-5173-31-6
P. 7
A Filtered Trace Element Ratios B Crustal Thickness Estimates
200 60 90
early Cenozoic Sr/Y La/Yb Paired
Sr/Y 50 80 thickening
150 La/Yb 70
40 60 slab rollback slab rollback
Sr/Y 100 30 La/Yb Crustal Thickness (km) 50 extension acceleration slab rollback?
20 40
50 30
10 onset of extension limited data
20
0 0 10
0 25 50 75 100 125 150 175 200 0 25 50 75 100 125 150 175 200
Age (Ma) Age (Ma)
C Gaussian Kernel Regression Model D Linear Segment Rates
90 90
Paired calibration 80 1.3 ± 0.1 mm/a −0.8 ± 0.05 mm/a
Paired calibration
80
Crustal Thickness (km) 60 thickening thinning Crustal Thickness (km) 60 thickening thinning
70
70
crustal
crustal
50
50
crustal
40
40
crustal
30
20
20
crustal
crustal
thinning limited data 30 thinning −0.7 ± 0.1 mm/a
10 10
0 25 50 75 100 125 150 175 200 0 25 50 75 100 125 150 175 200
Age (Ma) Age (Ma)
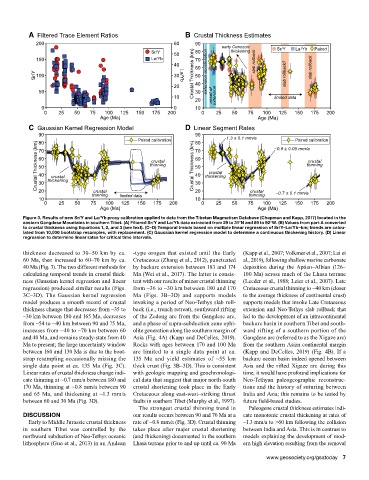
Figure 3. Results of new Sr/Y and La/Yb proxy calibration applied to data from the Tibetan Magmatism Database (Chapman and Kapp, 2017) located in the
eastern Gangdese Mountains in southern Tibet. (A) Filtered Sr/Y and La/Yb data extracted from 29 to 31°N and 89 to 92°W. (B) Values from part A converted
to crustal thickness using Equations 1, 2, and 3 (see text). (C–D) Temporal trends based on multiple linear regression of Sr/Y–La/Yb–km; trends are calcu-
lated from 10,000 bootstrap resamples, with replacement. (C) Gaussian kernel regression model to determine a continuous thickening history. (D) Linear
regression to determine linear rates for critical time intervals.
thickness decreased to 30–50 km by ca. -type orogen that existed until the Early (Kapp et al., 2007; Volkmer et al., 2007; Lai et
60 Ma, then increased to 60–70 km by ca. Cretaceous (Zhang et al., 2012), punctuated al., 2019), following shallow marine carbonate
40 Ma (Fig. 3). The two different methods for by backarc extension between 183 and 174 deposition during the Aptian–Albian (126–
calculating temporal trends in crustal thick- Ma (Wei et al., 2017). The latter is consis- 100 Ma) across much of the Lhasa terrane
ness (Gaussian kernel regression and linear tent with our results of minor crustal thinning (Leeder et al., 1988; Leier et al., 2007). Late
regression) produced similar results (Figs. from ~36 to ~30 km between 180 and 170 Cretaceous crustal thinning to ~40 km (closer
3C–3D). The Gaussian kernel regression Ma (Figs. 3B–3D) and supports models to the average thickness of continental crust)
model produces a smooth record of crustal invoking a period of Neo-Tethys slab roll- supports models that invoke Late Cretaceous
thickness change that decreases from ~35 to back (i.e., trench retreat), southward rifting extension and Neo-Tethys slab rollback that
~30 km between 180 and 165 Ma, decreases of the Zedong arc from the Gangdese arc, led to the development of an intracontinental
from ~54 to ~40 km between 90 and 75 Ma, and a phase of supra-subduction zone ophi- backarc basin in southern Tibet and south-
increases from ~40 to ~70 km between 60 olite generation along the southern margin of ward rifting of a southern portion of the
and 40 Ma, and remains steady-state from 40 Asia (Fig. 4A) (Kapp and DeCelles, 2019). Gangdese arc (referred to as the Xigaze arc)
Ma to present; the large uncertainty window Rocks with ages between 170 and 100 Ma from the southern Asian continental margin
between 160 and 130 Ma is due to the boot- are limited to a single data point at ca. (Kapp and DeCelles, 2019) (Fig. 4B). If a
strap resampling occasionally missing the 135 Ma and yield estimates of ~55 km backarc ocean basin indeed opened between
single data point at ca. 135 Ma (Fig. 3C). thick crust (Fig. 3B–3D). This is consistent Asia and the rifted Xigaze arc during this
Linear rates of crustal thickness change indi- with geologic mapping and geochronologi- time, it would have profound implications for
cate thinning at ~0.7 mm/a between 180 and cal data that suggest that major north-south Neo-Tethyan paleogeographic reconstruc-
170 Ma, thinning at ~0.8 mm/a between 90 crustal shortening took place in the Early tions and the history of suturing between
and 65 Ma, and thickening at ~1.3 mm/a Cretaceous along east-west–striking thrust India and Asia; this remains to be tested by
between 60 and 30 Ma (Fig. 3D). faults in southern Tibet (Murphy et al., 1997). future field-based studies.
The strongest crustal thinning trend in Paleogene crustal thickness estimates indi-
DISCUSSION our results occurs between 90 and 70 Ma at a cate monotonic crustal thickening at rates of
Early to Middle Jurassic crustal thickness rate of ~0.8 mm/a (Fig. 3D). Crustal thinning ~1.3 mm/a to >60 km following the collision
in southern Tibet was controlled by the takes place after major crustal shortening between India and Asia. This is in contrast to
northward subduction of Neo-Tethys oceanic (and thickening) documented in the southern models explaining the development of mod-
lithosphere (Guo et al., 2013) in an Andean Lhasa terrane prior to and up until ca. 90 Ma ern high elevation resulting from the removal
www.geosociety.org/gsatoday 7