
Page 5 - i1052-5173-31-6
P. 5
80°E 84°E 88°E 92°E 90°E 92°E
d d d d
d d d d d d & 31°N
& d $
& d d $ d d $
32°N d d d d d & d d d d d $ d d d Nam Co d
Lunggar
Lunggar
Lunggar d & & d d d d d d d
Nam Co
Nam Co
d
Nyainqentanghla
Nyainqentanghla
d d ddd d d d d d
Pum Qu-Xainza
d d & d d d d d d Tangra Yumco Tangra Yumco Tangra Yumco d d d Nyainqentanghla d d d d & & d d d d
30°N d d d d d d d d d d d d d d d d d d d
Lhasa
Lhasa
d d Pum Qu-Xainza Lhasa dd d ! (
d d d Pum Qu-Xainza d d d ! ( ! ( ( ! ( ! ( 30°N
d
( ( d d ! ( ! ( ! ( ! ( ! ( ! ( ! ( ! (
( d d d
( d d d d d ! ( ! ( ! ( ! ( d Lhasaa ! (
Lhas
Lhasa
( d d $ d d ! ( ! ( ! ( ! ( ! ( ! ( ! ( d ! ( ! ( ! ( ! ( ! ( ! ( ! ( ! ( ! ( ! ( ! ( ! ( ! (
28°N $ d ( ! ( ! ( ! ( ! ( ! ( ! ( ! ( ! ( ! ( ! (
Kathmanduthmanduthmandu
Ka
( ( ( Ka ( ! ( ! ( ! ( ! ( ! ( ! ( ! ( ! ( ! (!!! ! ( ! ( d
! ( ! ( ! ( ! ( ((( ! ( ! ( ! ( ! ( ! ( ! ( ! ( ! (
( ( ( d ( ! ( ! ( ! ( ! ( ! ( ! ( ! ( ! ( ! ( ! (! ( ! ( ! ( ! ( ! ( ! ( ! ( ! ( ! ( ! ( ! ( ! ( ! ( ! ( ! ( ! ( ! ( ! ( ! ( ! ( ! ( ! ( ! ( ! ( !
0 100 200 ( ( ( ( ( ! ( ! ( ! ( ( ! ( ! ( ! ( ! ( ! (! ( ! ( ! ( ! ( ! ( ! ( ! ( ! ( ! ( ! ( ! ( ! ( ! ( ! ( ! ( ! ( ! ( ! ( ! ( ! ( ! ( ! ( ! ( ! ( ! ( ! ( ! ( ! ( ! (((((((((( ! ( d
! ( ( ! ( ! ( ! ( ! ( ! ( ! ( ! ( ! ! ! ! ! ! ! ! ! ( (( ( ! (
! ( ! ( ! ( ! ( ! (!!!!
! ( ! ( ! (!
Km ( ( ( ( ( ( ( ( ( ( ( (
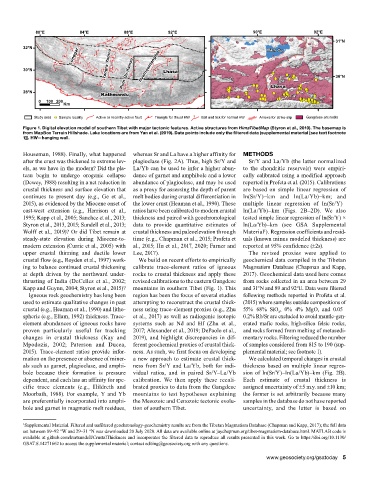
Study area ! ( Sample locality Active or recently active fault + Triangle for thrust HW Ball and tick for normal HW Arrows for strike-slip Gangdese arc rocks
Figure 1. Digital elevation model of southern Tibet with major tectonic features. Active structures from HimaTibetMap (Styron et al., 2010). The basemap is
from MapBox Terrain Hillshade. Lake locations are from Yan et al. (2019). Data points include only the filtered data (supplemental material [see text footnote
1]). HW—hanging wall.
Houseman, 1988). Finally, what happened whereas Sr and La have a higher affinity for METHODS
after the crust was thickened to extreme lev- plagioclase (Fig. 2A). Thus, high Sr/Y and Sr/Y and La/Yb (the latter normalized
els, as we have in the modern? Did the pla- La/Yb can be used to infer a higher abun- to the chondritic reservoir) were empiri-
teau begin to undergo orogenic collapse dance of garnet and amphibole and a lower cally calibrated using a modified approach
(Dewey, 1988) resulting in a net reduction in abundance of plagioclase, and may be used reported in Profeta et al. (2015). Calibrations
crustal thickness and surface elevation that as a proxy for assessing the depth of parent are based on simple linear regression of
continues to present day (e.g., Ge et al., melt bodies during crustal differentiation in ln(Sr/Y)–km and ln(La/Yb)–km; and
2015), as evidenced by the Miocene onset of the lower crust (Heaman et al., 1990). These multiple linear regression of ln(Sr/Y)–
east-west extension (e.g., Harrison et al., ratios have been calibrated to modern crustal ln(La/Yb)–km (Figs. 2B–2D). We also
1995; Kapp et al., 2005; Sanchez et al., 2013; thickness and paired with geochronological tested simple linear regression of ln(Sr/Y) ×
Styron et al., 2013, 2015; Sundell et al., 2013; data to provide quantitative estimates of ln(La/Yb)–km (see GSA Supplemental
Wolff et al., 2019)? Or did Tibet remain at crustal thickness and paleoelevation through Material ). Regression coefficients and resid-
1
steady-state elevation during Miocene-to- time (e.g., Chapman et al., 2015; Profeta et uals (known minus modeled thickness) are
modern extension (Currie et al., 2005) with al., 2015; Hu et al., 2017, 2020; Farner and reported at 95% confidence (±2s).
upper crustal thinning and ductile lower Lee, 2017). The revised proxies were applied to
crustal flow (e.g., Royden et al., 1997) work- We build on recent efforts to empirically geochemical data compiled in the Tibetan
ing to balance continued crustal thickening calibrate trace-element ratios of igneous Magmatism Database (Chapman and Kapp,
at depth driven by the northward under- rocks to crustal thickness and apply these 2017). Geochemical data used here comes
thrusting of India (DeCelles et al., 2002; revised calibrations to the eastern Gangdese from rocks collected in an area between 29
Kapp and Guynn, 2004; Styron et al., 2015)? mountains in southern Tibet (Fig. 1). This and 31°N and 89 and 92°E. Data were filtered
Igneous rock geochemistry has long been region has been the focus of several studies following methods reported in Profeta et al.
used to estimate qualitative changes in past attempting to reconstruct the crustal thick- (2015) where samples outside compositions of
crustal (e.g., Heaman et al., 1990) and litho- ness using trace-element proxies (e.g., Zhu 55%–68% SiO , 0%–4% MgO, and 0.05–
2
spheric (e.g., Ellam, 1992) thickness. Trace- et al., 2017) as well as radiogenic isotopic 0.2% Rb/Sr are excluded to avoid mantle-gen-
element abundances of igneous rocks have systems such as Nd and Hf (Zhu et al., erated mafic rocks, high-silica felsic rocks,
proven particularly useful for tracking 2017; Alexander et al., 2019; DePaolo et al., and rocks formed from melting of metasedi-
changes in crustal thickness (Kay and 2019), and highlight discrepancies in dif- mentary rocks. Filtering reduced the number
Mpodozis, 2002; Paterson and Ducea, ferent geochemical proxies of crustal thick- of samples considered from 815 to 190 (sup-
2015). Trace-element ratios provide infor- ness. As such, we first focus on developing plemental material; see footnote 1).
mation on the presence or absence of miner- a new approach to estimate crustal thick- We calculated temporal changes in crustal
als such as garnet, plagioclase, and amphi- ness from Sr/Y and La/Yb, both for indi- thickness based on multiple linear regres-
bole because their formation is pressure vidual ratios, and in paired Sr/Y–La/Yb sion of ln(Sr/Y)–ln(La/Yb)–km (Fig. 2B).
dependent, and each has an affinity for spe- calibration. We then apply these recali- Each estimate of crustal thickness is
cific trace elements (e.g., Hildreth and brated proxies to data from the Gangdese assigned uncertainty of ±5 m.y. and ±10 km;
Moorbath, 1988). For example, Y and Yb mountains to test hypotheses explaining the former is set arbitrarily because many
are preferentially incorporated into amphi- the Mesozoic and Cenozoic tectonic evolu- samples in the database do not have reported
bole and garnet in magmatic melt residues, tion of southern Tibet. uncertainty, and the latter is based on
1 Supplemental Material. Filtered and unfiltered geochronology-geochemistry results are from the Tibetan Magmatism Database (Chapman and Kapp, 2017); the full data
set between 89–92 °W and 29–31 °N was downloaded 20 July 2020. All data are available online at jaychapman.org/tibet-magmatism-database.html. MATLAB code is
available at github.com/kurtsundell/CrustalThickness and incorporates the filtered data to reproduce all results presented in this work. Go to https://doi.org/10.1130/
GSAT.S.14271662 to access the supplemental material; contact editing@geosociety.org with any questions.
www.geosociety.org/gsatoday 5