
Page 7 - i1052-5173-30-10 + Annual Report
P. 7
Our data on plant stomatal response to a the American Midwest with relatively stable 1829 of 30 mm evapotranspiration, and as
well-mixed atmosphere reflects global CO , climate (Fig. 1B), a comparable decline in much added to runoff.
2
but our assessment of flooding response transpiration is likely. Our result also assumes
was limited to upper Mississippi River data that the stomatal response of Ginkgo is com- RISING WATERS
derived from public databases (U.S. Army parable with that of dominant Midwestern Records of Mississippi River levels at
Corps of Engineers, 2019). This region was plants such as Quercus, because both show Hannibal, Missouri (U.S. Army Corps of
also chosen because of available data on cli- comparable slopes in stomatal CO response Engineers, 2019), go back to 1888, and since
2
mate change (National Oceanographic and over changing historic CO concentrations that time, mean annual river levels have risen
2
Atmospheric Administration, 2019a) and (Royer et al., 2001). Furthermore, comparable in proportion to the decline in maximum
land use (Clausen, 1979; Sohl et al., 2016; data from Quercus laurifolia from a Florida transpiration of Ginkgo (Fig. 4B). Flood lev-
Andersen et al., 1996; U.S. Department of swamp (Lammertsma et al., 2011) straddles els also increased over time, but their sever-
Agriculture Statistics Service, 2019). our data (Figs. 3B–3C, 4A) but with greater ity has been erratic (Fig. 1A). Other factors
variance due to smaller cell counts. Quercus promoting flooding include reduced transpi-
RESULTS is a dominant plant throughout much of the ration from replacement of trees with grasses
Our study is based on measurements of sto- northern hemisphere (Manos et al., 1999). (Alton et al., 2009; Morton et al., 2015),
matal parameters of herbarium specimens of The central Mississippi River had estimated observed in pollen records (Sohl et al., 2016),
Ginkgo biloba extending back to 1754 (Fig. 2). summer monthly evapotranspiration (Mu et and maintenance of hard surfaces such as
Ginkgo stomatal proxies are similar to those al., 2013) of 90 mm by 2010. The transpiration roads and parking lots to service continu-
established for Quercus and other plants decline 1829–2015 is 29%, for a decline since ously developed acreages (U.S. Department
(Royer et al., 2001; Lammertsma et al., 2011;
Franks et al., 2014), and the Ginkgo stomatal
record is among the best known (Barclay and
Wing, 2016; Retallack and Conde, 2020).
Measures of stomatal length and width can be
used to calculate maximum pore area and vol-
ume (Franks et al., 2014) and infer water con-
ductance from leaves using the physics of dif-
fusion through pores (Cussler, 1997). Our
records show a secular decline in stomatal
index, or percent stomates versus epidermal
cells (Equation 1), of Ginkgo with increasing
atmospheric CO as measured since 1955 on
2
Mauna Loa (National Oceanographic and
Atmospheric Organization, 2019b) with a
base line provided by earlier data (Lüthi et al.,
2008) from ice cores (Fig. 3A). The change in
Ginkgo stomatal index over the past 265 years
was due more to changes in stomatal density
(Fig. 3B) than to stomatal size (Fig. 3C), and
our high-precision data from Ginkgo are sup-
ported by less-accurate data from Quercus
(Lammertsma et al., 2011). There is evidence
from fossils that stomatal size also changes
when atmospheric CO is very high (Retallack,
2
2009; Franks and Beerling, 2009), but that
threshold was not reached in our observa-
tions. Stomatal size also changes significantly
with gene ploidy levels (McElwain and
Steinthorsdottir, 2017), but such jumps were
not seen in our data either.
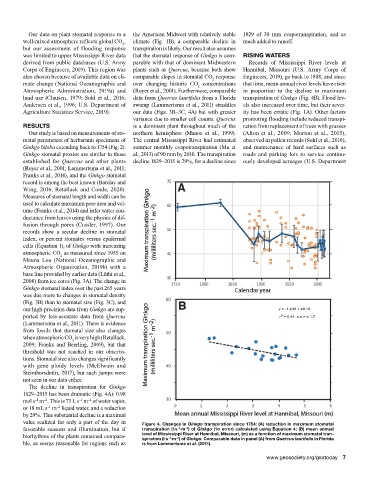
The decline in transpiration for Ginkgo
1829–2015 has been dramatic (Fig. 4A): 0.98
mol s m . This is 73 L s m of water vapor,
–2
–1
–2
–1
or 18 mL s m liquid water, and a reduction
–2
–1
by 29%. This substantial decline is a maximal
value realized for only a part of the day in Figure 4. Changes in Ginkgo transpiration since 1754: (A) reduction in maximum stomatal
favorable seasons and illumination, but if transpiration (l·s ·m ) of Ginkgo (1σ error) calculated using Equation 4; (B) mean annual
–1
–2
biorhythms of the plants remained compara- level of Mississippi River at Hannibal, Missouri, (m) as a function of maximum stomatal tran-
spiration (l·s ·m ) of Ginkgo. Comparable data in panel (A) from Quercus laurifolia in Florida
–2
–1
ble, as seems reasonable for regions such as is from Lammertsma et al. (2011).
www.geosociety.org/gsatoday 7