
Page 4 - i1052-5173-30-10 + Annual Report
P. 4
Flooding Induced by Rising Atmospheric
Carbon Dioxide
Gregory J. Retallack* and Giselle D. Conde, Dept. of Earth Sciences, University of Oregon, Eugene, Oregon 97403-1272, USA
ABSTRACT
A direct consequence of rising CO is
2
increasingly devastating flooding, because
deciduous plants deploy fewer stomates each
year as the atmospheric CO supplies more
2
carbon for photosynthesis. When plants tran-
spire less, more water runs off in streams and
floods. Here we quantify this effect with high-
resolution observations of changing density
and size of stomates of a mesic tree, Ginkgo,
since 1754. The observed decline in maxi-
mum potential transpiration corresponds with
rising water levels in the Mississippi River
and represents a potential transpiration
decline from 1829 to 2015 of 18 mL s m : a
–1
–2
reduction of 29%. Rising atmospheric CO
2
and declining transpiration promote flooding,
which handicaps lowland cultivation and ren-
ders irrelevant insurance and zoning concepts
such as the 100-year flood.
INTRODUCTION
Ongoing climatic change with rising atmo-
spheric greenhouse gases (Yan et al., 2016) is
disproportionally affecting tropical regions
with sterilizing heat waves (Mora et al., 2017)
and polar regions with disappearing sea ice
(Kwok, 2018), but is less apparent in the
American Midwest, thus allowing skepticism
of global warming science (Wallace et al.,
2014). Nevertheless, Midwestern cities and
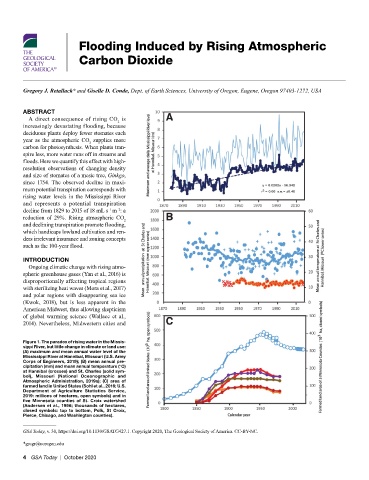
Figure 1. The paradox of rising water in the Missis-
sippi River, but little change in climate or land use:
(A) maximum and mean annual water level of the
Mississippi River at Hannibal, Missouri (U.S. Army
Corps of Engineers, 2019); (B) mean annual pre-
cipitation (mm) and mean annual temperature (°C)
at Hannibal (crosses) and St. Charles (solid sym-
bol), Missouri (National Oceanographic and
Atmospheric Administration, 2019a); (C) area of
farmed land in United States (Sohl et al., 2016; U.S.
Department of Agriculture Statistics Service,
2019: millions of hectares, open symbols) and in
five Minnesota counties of St. Croix watershed
(Andersen et al., 1996; thousands of hectares,
closed symbols: top to bottom, Polk, St Croix,
Pierce, Chisago, and Washington counties).
GSA Today, v. 30, https://doi.org/10.1130/GSATG427.1. Copyright 2020, The Geological Society of America. CC-BY-NC.
*gregr@uoregon.edu
4 GSA Today | October 2020