
Page 5 - i1052-5173-30-10 + Annual Report
P. 5
agriculture have been progressively ravaged
by flooding (Fosu et al., 2018). Steadily
increased floods and general level (U.S. Army
Corps of Engineers, 2019) of the Mississippi
River (Fig. 1A) have been independent of
local climatic changes in precipitation and
temperature (National Oceanographic and
Atmospheric Administration, 2019a), which
have remained surprisingly flat (Fig. 1B). Nor
can increases in farmed areas be blamed for
rising flood levels, because Midwestern culti-
vated acreage reached a plateau between 1900
and 1960 (Clausen, 1979; Sohl et al., 2016;
Andersen et al., 1996; U.S. Department of
Agriculture Statistics Service, 2019), and has
declined slightly since then (Fig. 1C).
Flooding is a long-term and direct
response to rising atmospheric CO concen-
2
trations of much greater consequence in
mid-latitudes than temperature increases,
and it has been observed for decades.
Deciduous trees adapt to rising CO annu-
2
ally by developing fewer stomates on spring
leaves, because adequate CO for photosyn-
2
thesis can be obtained by reduced air intake
(Sugano et al., 2010; Chater et al., 2015).
Fewer stomates also reduce plant transpira-
tion of water, so that more precipitation
runs off in rivers and floods (Betts et al.,
2007). The relationship between CO and
2
stomatal density has been known for some
time (Woodward, 1987), and there have
been many attempts at quantifying the rela-
tionship (Royer et al., 2001; Retallack, 2001,
2009; Barclay and Wing, 2016; McElwain
and Steinthorsdottir, 2017). Here we update
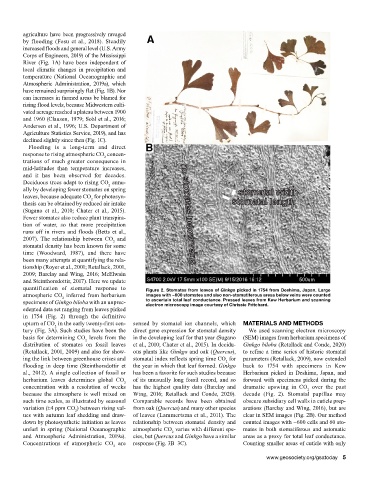
quantification of stomatal response to Figure 2. Stomates from leaves of Ginkgo picked in 1754 from Deshima, Japan. Large
atmospheric CO inferred from herbarium images with ~600 stomates and also non-stomatiferous areas below veins were counted
2
specimens of Ginkgo biloba with an unprec- to ascertain total leaf conductance. Pressed leaves from Kew Herbarium and scanning
electron microscopy image courtesy of Chrissie Pritchard.
edented data set ranging from leaves picked
in 1754 (Fig. 2) through the definitive
upturn of CO in the early twenty-first cen- sensed by stomatal ion channels, which MATERIALS AND METHODS
2
tury (Fig. 3A). Such studies have been the direct gene expression for stomatal density We used scanning electron microscopy
basis for determining CO levels from the in the developing leaf for that year (Sugano (SEM) images from herbarium specimens of
2
distribution of stomates on fossil leaves et al., 2010; Chater et al., 2015). In decidu- Ginkgo biloba (Retallack and Conde, 2020)
(Retallack, 2001, 2009) and also for show- ous plants like Ginkgo and oak (Quercus), to refine a time series of historic stomatal
ing the link between greenhouse crises and stomatal index reflects spring time CO for parameters (Retallack, 2009), now extended
2
flooding in deep time (Steinthorsdottir et the year in which that leaf formed. Ginkgo back to 1754 with specimens in Kew
al., 2012). A single collection of fossil or has been a favorite for such studies because Herbarium picked in Deshima, Japan, and
herbarium leaves determines global CO of its unusually long fossil record, and so forward with specimens picked during the
2
concentration with a resolution of weeks has the highest quality data (Barclay and dramatic upswing in CO over the past
2
because the atmosphere is well mixed on Wing, 2016; Retallack and Conde, 2020). decade (Fig. 2). Stomatal papillae may
such time scales, as illustrated by seasonal Comparable records have been obtained obscure subsidiary cell walls in cuticle prep-
variation (±4 ppm CO ) between rising val- from oak (Quercus) and many other species arations (Barclay and Wing, 2016), but are
2
ues with autumn leaf shedding and draw- of leaves (Lammertsma et al., 2011). The clear in SEM images (Fig. 2B). Our method
down by photosynthetic initiation as leaves relationship between stomatal density and counted images with ~600 cells and 60 sto-
unfurl in spring (National Oceanographic atmospheric CO varies with different spe- mates in both stomatiferous and astomatic
2
and Atmospheric Administration, 2019a). cies, but Quercus and Ginkgo have a similar areas as a proxy for total leaf conductance.
Concentrations of atmospheric CO are response (Fig. 3B–3C). Counting smaller areas of cuticle with only
2
www.geosociety.org/gsatoday 5