
Page 6 - i1052-5173-30-10 + Annual Report
P. 6
5–16 stomates (Barclay and Wing, 2016)
gives unacceptable systematic errors of sto-
matal index: ~20% depending on whether
four or five stomates are accidently in the
image. Stomatal bands are distinct from
astomatic areas below veins, but we counted
both stomatal and subvenal areas to capture
total leaf conductance (Fig. 2B).
The current stomatal index CO paleoba-
2
rometer (Retallack and Conde, 2020) is
based on atmospheric CO (C in ppm) from
2
observations (National Oceanographic and
Atmospheric Administration, 2019b) and ice
cores (Lüthi et al., 2008) together with sto-
matal index (I in % from Equation 1) from
microscopic imaging of herbarium speci-
mens in which number of stomates (n ) and
s
number of epidermal cells (n ) in the same
e
area are counted. This inverse relationship
(Equation 2) has an algebraically simplified
equivalent (Equation 3) between Gingko sto-
matal index (I in %) and atmospheric CO
2
(C in ppm). Standard deviations (1s) of CO
2
concentration (in ppm) were calculated
by Gaussian error propagation. Maximum
potential transpiration (g wmax in mol·m s )
–2 –1
can be calculated using Equation 4 (Wolfram
Alpha, 2019; Franks et al., 2014) with addi-
tional measurements of stomatal pore length
(l, in m), width (w, in m), and density of sto-
mates (D, as number per m ), as well as phys-
2
ical constants (Cussler, 1997) of diffusivity
of water vapor in air (d = 0.0000282 m ·s )
–2
–1
and molar volume of air (v = 0.0224
m ·mol ), and 0.6 area correction factor for
–1
–3
Ginkgo biloba stomatal anatomy (Franks et
al., 2014). Diffusivity and molar volumes of
vapor and liquid are all at 25 °C and 1 atm.
All measurements of Ginkgo biloba stomatal
density, length, and width are included in the
GSA supplemental material. 1
n
I 100 n s n (1)
s e
1
C 239 7 (2)
. 2 75255 10 7 I . 4 79
C 239 73 ,633 ,000 I . 479 (3)
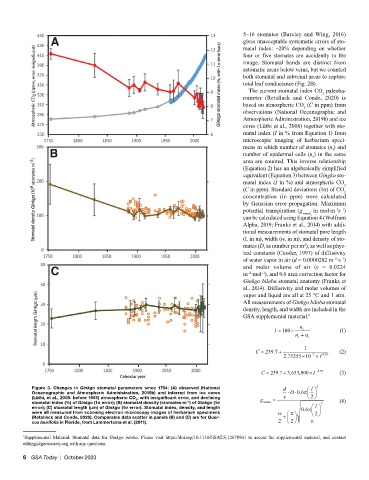
Figure 3. Changes in Ginkgo stomatal parameters since 1754: (A) observed (National d l 2
Oceanographic and Atmospheric Administration, 2019b) and inferred from ice cores D 06.
(Lüthi, et al., 2008: before 1955) atmospheric CO , with insignificant error, and declining g v 2 (4)
2
stomatal index (%) of Ginkgo (1σ error); (B) stomatal density (stomates·m ) of Ginkgo (1σ wmax l 2
–2
error); (C) stomatal length (μm) of Ginkgo (1σ error). Stomatal index, density, and length 06 .
were all measured from scanning electron microscopy images of herbarium specimens w 2
(Retallack and Conde, 2020). Comparable data scatter in panels (B) and (C) are for Quer- 2 2
cus laurifolia in Florida, from Lammertsma et al. (2011).
1 Supplemental Material: Stomatal data for Ginkgo biloba. Please visit https://doi.org/10.1130/GSAT.S.12678941 to access the supplemental material, and contact
editing@geosociety.org with any questions.
6 GSA Today | October 2020