
Page 8 - i1052-5173-32-6
P. 8
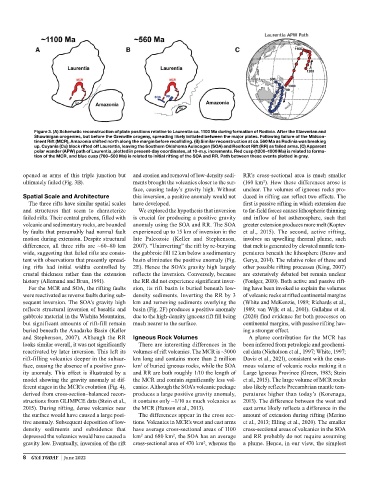
Figure 3. (A) Schematic reconstruction of plate positions relative to Laurentia ca. 1100 Ma during formation of Rodinia. After the Elzeverian and
            Shawinigan orogenies, but before the Grenville orogeny, spreading likely initiated between the major plates. Following failure of the Midcon-
            tinent Rift (MCR), Amazonia shifted north along the margin before recolliding. (B) Similar reconstruction at ca. 560 Ma as Rodinia was breaking
            up. Cuyania (Cu) block rifted off Laurentia, leaving the Southern Oklahoma Aulacogen (SOA) and Reelfoot Rift (RR) as failed arms. (C) Apparent
            polar wander (APW) path of Laurentia, plotted in present-day coordinates, at 10-m.y. increments. Red cusp (1200–1000 Ma) is related to forma-
            tion of the MCR, and blue cusp (700–500 Ma) is related to initial rifting of the SOA and RR. Path between these events plotted in gray.


         opened as arms of this triple junction but   and erosion and removal of low-density sedi-  RR’s cross-sectional area is much smaller
         ultimately failed (Fig. 3B).        ments brought the volcanics closer to the sur-  (160 km ). How these differences arose is
                                                                                       2
                                             face, causing today’s gravity high. Without   unclear. The volumes of igneous rocks pro-
         Spatial Scale and Architecture      this inversion, a positive anomaly would not   duced in rifting can reflect two effects. The
          The three rifts have similar spatial scales   have developed.         first is passive rifting in which extension due
         and structures that seem to characterize   We explored the hypothesis that inversion   to far-field forces causes lithospheric thinning
         failed rifts. Their central grabens, filled with   is crucial for producing a positive gravity   and inflow of hot asthenosphere, such that
         volcanic and sedimentary rocks, are bounded   anomaly using the SOA and RR. The SOA   greater extension produces more melt (Koptev
         by faults that presumably had normal fault   experienced up to 15 km of inversion in the   et al., 2015). The second, active rifting,
         motion during extension. Despite structural   late Paleozoic (Keller and Stephenson,   involves an upwelling thermal plume, such
         differences, all three rifts are ~60–80 km   2007). “Uninverting” the rift by re-burying   that melt is generated by elevated mantle tem-
         wide, suggesting that failed rifts are consis-  the gabbroic fill 12 km below a sedimentary   peratures beneath the lithosphere (Burov and
         tent with observations that presently spread-  basin eliminates the positive anomaly (Fig.   Gerya, 2014). The relative roles of these and
         ing  rifts  had initial widths controlled by   2E). Hence the SOA’s gravity high largely   other possible rifting processes (King, 2007)
         crustal thickness rather than the extension   reflects the inversion. Conversely, because   are extensively debated but remain unclear
         history (Allemand and Brun, 1991).  the RR did not experience significant inver-  (Foulger, 2010). Both active and passive rift-
          For the MCR and SOA, the rifting faults   sion, its rift basin is buried beneath low-  ing have been invoked to explain the volumes
         were reactivated as reverse faults during sub-  density sediments. Inverting the RR by 3   of volcanic rocks at rifted continental margins
         sequent inversion. The SOA’s gravity high   km and removing sediments overlying the   (White and McKenzie, 1989; Richards et al.,
         reflects structural inversion of basaltic and   basin (Fig. 2F) produces a positive anomaly   1989; van Wijk et al., 2001). Gallahue et al.
         gabbroic material in the Wichita Mountains,   due to the high-density igneous rift fill being   (2020) find evidence for both processes on
         but significant amounts of rift-fill remain   much nearer to the surface.  continental margins, with passive rifting hav-
         buried beneath the Anadarko Basin (Keller                              ing a stronger effect.
         and Stephenson, 2007). Although the RR   Igneous Rock Volumes            A plume contribution for the MCR has
         looks similar overall, it was not significantly   There are interesting differences in the   been inferred from petrologic and geochemi-
         reactivated by later inversion. This left its   volumes of rift volcanics. The MCR is ~3000   cal data (Nicholson et al., 1997; White, 1997;
         rift-filling volcanics deeper in the subsur-  km long and contains more than 2 million   Davis et al., 2021), consistent with the enor-
         face, causing the absence of a positive grav-  km  of buried igneous rocks, while the SOA   mous volume of volcanic rocks making it a
                                               3
         ity anomaly. This effect is illustrated by a   and RR are both roughly 1/10 the length of   Large Igneous Province (Green, 1983; Stein
         model showing the gravity anomaly at dif-  the MCR and contain significantly less vol-  et al., 2015). The large volume of MCR rocks
         ferent stages in the MCR’s evolution (Fig. 4),   canics. Although the SOA’s volcanic package   also likely reflects Precambrian mantle tem-
         derived from cross-section–balanced recon-  produces a large positive gravity anomaly,   peratures higher than today’s (Korenaga,
         structions from GLIMPCE data (Stein et al.,   it contains only ~1/10 as much volcanics as   2013). The difference between the west and
         2015). During rifting, dense volcanics near   the MCR (Hanson et al., 2013).  east arms likely reflects a difference in the
         the surface would have caused a large posi-  The differences appear in the cross sec-  amount of extension during rifting (Merino
         tive anomaly. Subsequent deposition of low-  tions. Volcanics in MCR’s west and east arms   et al., 2013; Elling et al., 2020). The smaller
         density sediments and subsidence that   have average cross-sectional areas of 1100   cross-sectional areas of volcanics in the SOA
         depressed the volcanics would have caused a   km  and 680 km , the SOA has an average   and RR probably do not require assuming
                                                          2
                                               2
         gravity low. Eventually, inversion of the rift   cross-sectional area of 470 km , whereas the   a plume. Hence, in our view, the simplest
                                                                    2
         8  GSA TODAY  |  June 2022