
Page 6 - i1052-5173-32-6
P. 6
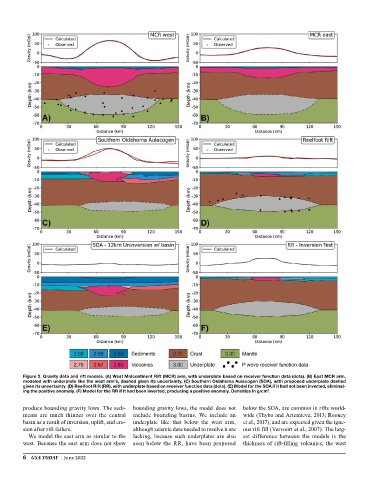
Figure 2. Gravity data and rift models. (A) West Midcontinent Rift (MCR) arm, with underplate based on receiver function data (dots). (B) East MCR arm,
         modeled with underplate like the west arm’s, dashed given its uncertainty. (C) Southern Oklahoma Aulacogen (SOA), with proposed underplate dashed
         given its uncertainty. (D) Reelfoot Rift (RR), with underplate based on receiver function data (dots). (E) Model for the SOA if it had not been inverted, eliminat-
         ing the positive anomaly. (F) Model for the RR if it had been inverted, producing a positive anomaly. Densities in g/cm . 3

         produce bounding gravity lows. The sedi-  bounding gravity lows, the model does not   below the SOA, are common in rifts world-
         ments are much thinner over the central   include bounding basins. We include an   wide (Thybo and Artemieva, 2013; Rooney
         basin as a result of inversion, uplift, and ero-  underplate like that below the west arm,   et al., 2017), and are expected given the igne-
         sion after rift failure.            although seismic data needed to resolve it are   ous rift fill (Vervoort et al., 2007). The larg-
          We model the east arm as similar to the   lacking, because such underplates are also   est  difference  between  the  models  is the
         west. Because the east arm does not show   seen below the RR, have been proposed   thickness of rift-filling volcanics; the west

         6  GSA TODAY  |  June 2022