
Page 7 - i1052-5173-27-3-4
P. 7
A
Leech R. B1Sooke R. B2
P3
Bedrock fault
slick 200 m
N
C P5
100 m
B P4
slickenside Till Till
Bedrock
N P4 S P5 S
N
Height (m)bedrock P3 N
-10 0 10
Height (m)sediments
-5 0 5
Height (m)
-5 0 5
NS UD DU
-30 -1D5 istan0ce (m1)5 30 -80 -40 0 40 80 -60 -30 0 30 60
Distance (m) Distance (m)
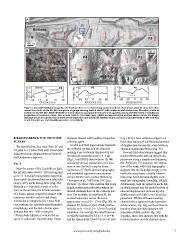
Figure 4. (A) LiDAR hillshade image for site B where there is a >1.5-km-long scarp in bedrock. Red arrows point to steep face. Ste-
reonet from fault at site B1. (B) Field photo of gouge-bearing fault at site B1, with subhorizontal slickenlines. Elevation profile at
bottom for site B2. (C) LiDAR hillshade for site C showing topographic features with opposing facing directions and a morphology
suggestive of pressure ridges. Red arrows point to the steep face. LiDAR-derived elevation profiles shown below the image.
Because structures are buried beneath dense vegetation and glacial till, fault locations are inferred (dashed lines on the profiles).
U and D denote up- and downthrown sides, respectively.
FIELD EVIDENCE FOR TECTONIC channels littered with boulders incise this (Fig. DR2). These estimates support our
SCARPS colluvial apron. field observations of a differential amount
of displacement across the scarp between
We identify three key sites (Figs. 2C and LiDAR and field data indicate that both channels versus interfluves (Fig. 3C).
2D, sites A–C) where field and LiDAR data the colluvial surface and the channels
indicate tectonic displacement of bedrock incising it are vertically displaced by sev- Several field observations suggest this
and Quaternary deposits. eral meters across the scarp (~3–6 m) scarp reflects north-side-up dip slip dis-
(Figs. 3 and DR1B [see footnote 1]). We placement along a steeply north-dipping
Site A calculated vertical separations at 12 loca- (60–90°) fault. For instance, the interac-
tions across the fault scarp by linear tion of the scarp with local topography
Near the center of the Leech River fault, regression of LiDAR-derived topography suggests that the fault dips steeply to the
the LiDAR data reveal a >200-m-long and and estimated regression uncertainties north; the scarp trace is nearly linear in
up to ~3–6-m-high topographic scarp that using a Monte Carlo routine (following map view, but it deviates slightly north-
faces uphill (southward) across a relatively Thompson et al., 2002) (Fig. DR2 [see ward into topographic lows (Fig. DR2A).
steep (~20°), north-facing slope (Fig. 3A). footnote 1]). These data confirm that scarp Additionally, both the apparent north-side-
Beneath an ~1-m-thick mantle of collu- height is systematically lower within the up displacement and the spatial pattern of
vium at the surface, the hillside consists incised channels than on the colluvial sur- channel displacement indicate dip slip
of a dense, matrix-supported diamict with face. For example, at interfluve P1, the displacement with little to no lateral dis-
numerous erratics and striated clasts, vertical separation across the scarp placement. While northeast-trending
interpreted as subglacial till. These field approaches ~6 m (5.7 ± 1.7 m) (Fig. 3B). At channels show apparent right separation
observations, the relatively smooth surface channel P2, however, the LiDAR profiles (white arrows, Fig. 3A), north-northwest–
morphology, and the lack of a fan apex, indicate only ~3 m (3.2 ± 1.2 m) of vertical trending channels show apparent left
indicate that this ~400-m-long by separation. On average, the interfluves are separation (black arrows, Fig. 3A).
~300-m-wide hillside is covered by an vertically separated by 5.7 ± 1.3 m (n = 8) Together, these data indicate that both the
apron of colluvium. Several steep, linear and the channels by 3.9 ± 0.9 m (n = 4) (1s) colluvial surface and the channels have
www.geosociety.org/gsatoday 7