
Page 7 - i1052-5173-32-8
P. 7
Evaluating the severity of nuclear winter 3B). Temperatures would be so depressed On the other hand, some aspects of the
following a major nuclear war between the north of ~30° N latitude that crop failures simulations may represent underestimates
United States and Russia is hampered by would be widespread (if crops were even of potential environmental consequences.
many unknowns and poorly constrained planted) (Fig. 3C). (1) Estimates for the mass of injected smoke
variables, including specifics of weapon tar- One criticism of the relevance of this used by Coupe et al. (2019) were originally
geting, number of targets hit during a war, numerical simulation to real-world fires and made by the National Research Council
flammability and fuel load of targeted areas, nuclear winter is that black carbon is only a (1985) before a 40% increase in U.S. popu-
quantities and properties of resulting smoke, minor constituent of most fire smoke (esti- lation and associated construction of hous-
weather conditions, effectiveness of updrafts mated at ~12% for open-air burning [Bond et ing and other potentially flammable infra-
and self-lofting at delivering smoke to the al., 2004]; and estimated at only 2%–2.5% structure over the past 37 years (see also
stratosphere, and the fraction of black-carbon for stratospheric smoke injection from two Toon et al., 2008). (2) Numerical simula-
aerosol delivered. Weather conditions will wildfires [Yu et al., 2019, 2021]). Smoke par- tions with only 5 Tg of soot injected in the
affect fire intensity and pyroCb genesis while ticles produced by burning vegetation and stratosphere suggest 20%–50% ozone deple-
self-lofting by solar heating will be affected fossil-fuel combustion consist of complex tion and resulting 30%–80% increased UV
by the latitude and season. carbonaceous compounds typically contain- radiation at mid-latitudes, along with sig-
Regardless of these numerous uncertain- ing some hydrogen and oxygen (brown car- nificant global cooling (Mills et al., 2014).
ties, increasingly sophisticated numerical bon). Black carbon, the most carbon-rich (3) Abrupt, nuclear-explosion–triggered fires
simulations of global atmospheric response fraction, is the most resistant to degradation over large, roughly circular areas, and
to an all-out nuclear war have attempted to by sunlight and the most effective at absorb- ascent of mushroom clouds and inward-
determine the possible duration and sever- ing sunlight and warming the air around it flowing near-surface air, might be particu-
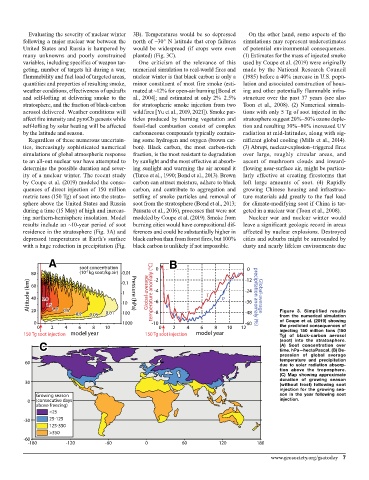
ity of a nuclear winter. The recent study (Turco et al., 1990; Bond et al., 2013). Brown larly effective at creating firestorms that
by Coupe et al. (2019) modeled the conse- carbon can attract moisture, adhere to black loft large amounts of soot. (4) Rapidly
quences of direct injection of 150 million carbon, and contribute to aggregation and growing Chinese housing and infrastruc-
metric tons (150 Tg) of soot into the strato- settling of smoke particles and removal of ture materials add greatly to the fuel load
sphere above the United States and Russia soot from the stratosphere (Bond et al., 2013; for climate-modifying soot if China is tar-
during a time (15 May) of high and increas- Pausata et al., 2016), processes that were not geted in a nuclear war (Toon et al., 2008).
ing northern-hemisphere insolation. Model modeled by Coupe et al. (2019). Smoke from Nuclear war and nuclear winter would
results include an ~10-year period of soot burning cities would have compositional dif- leave a significant geologic record in areas
residence in the stratosphere (Fig. 3A) and ferences and could be substantially higher in affected by nuclear explosions. Destroyed
depressed temperatures at Earth’s surface black carbon than from forest fires, but 100% cities and suburbs might be surrounded by
with a huge reduction in precipitation (Fig. black carbon is unlikely if not impossible. dusty and nearly lifeless environments due
A B B B
A A
0
(10 kg soot/kg air)
-7
80 soot concentration 0.01 -2 0 -12
Altitude (km) 60 2.0 1 10 Pressure (hPa) Global-average temperature anomaly (°C) -4 T p -24 precipitation anomaly (%) Global-average
0.1
40
2.0
2.0
-6
-36
1.5
1.5
1.5
1.0
1.0
1.0
0.5
0.5
0.5
20
0.011
0.01
0.2
0.2
0.2 0.05 0.0 100 -8 -48 Figure 3. Simplified results
0.05
0.05
from the numerical simulation
0 1000 -10 -60 of Coupe et al. (2019) showing
0 2 4 6 8 10 0 2 4 6 8 10 12 the predicted consequences of
injecting 150 million tons (150
150 Tg soot injection model year 150 Tg soot injection model year Tg) of black-carbon aerosol
C C C (soot) into the stratosphere.
(A) Soot concentration over
time. hPa—hectoPascal. (B) De-
pression of global average
60 temperature and precipitation
due to solar radiation absorp-
tion above the troposphere.
(C) Map showing approximate
duration of growing season
30 (without frost) following soot
injection for the growing sea-
Growing season son in the year following soot
0 (consecutive days injection.
above freezing)
<25
-30 25-125
125-350
>350
-60
-180 -120 -60 0 60 120 180
www.geosociety.org/gsatoday 7