
Page 6 - i1052-5173-32-8
P. 6
all other military bases, many of which are creates a global inversion layer that gener- lower stratosphere is followed by self-loft-
near or within cities or their surrounding ally prevents dust, water, and smoke from ing to higher altitudes in the stratosphere
suburbs. Other likely targets include infra- rising into the stratosphere. This boundary where very low water content prevents
structure for manufacturing and transporta- must be breached for smoke to cause global condensation and particulate rain-out.
tion, power generation and distribution, and nuclear winter. Furthermore, the black carbon component
oil and gas refining and distribution. Many Pyrocumulonimbus (pyroCb) clouds pro- of smoke is highly resistant to degradation
if not most of these targets are within or duced by rising hot air and smoke from by sunlight and can have a residence time
near cities and suburbs. Even cities them- large wildfires can inject smoke into the of months to years in the stratosphere
selves could be targets if the intention is upper troposphere and lower stratosphere (Peterson et al., 2021).
to prevent, for as long as possible, an (Fromm et al., 2010, 2021). PyroCb clouds The potential for smoke to enter the strato-
adversary’s ability to recover and re-arm are similar to typical thunderstorm clouds sphere and remain there for a long time is
(Richelson, 1985). Of the 1.35 billion people and form under similar conditions (Fig. 2B), illustrated by recent studies of pyroCb clouds
under the U.S. and Russian protective but they receive an extra boost from hot air generated by large forest fires. PyroCb
nuclear umbrellas, 85% of them are poten- rising above a fire (Fromm et al., 2006; clouds during a 2017 forest fire in southern
tially targeted by Russian nuclear forces. Rodriguez et al., 2020). Rainout of smoke British Columbia injected, or delivered by
This makes Russian nuclear-weapon– tar- due to water condensation on smoke parti- lofting, an estimated 33–300 thousand met-
geting far more important in determining cles is suppressed because of the warmth of ric tons (0.033–0.300 Tg) of smoke particles
the potential for nuclear winter. the pyroCb cloud, the rapid ascent rate of into the lower stratosphere (Yu et al., 2019;
The severity and duration of a nuclear heated air, and the small size of the abun- Fromm et al., 2021) where their presence was
winter would also depend on the amount of dant water-condensation droplets (Rosenfeld apparent for ~10 months as the smoke trav-
smoke that ascends to the upper troposphere et al., 2007). As a result, smoke particles in eled around Earth (Torres et al., 2020). The
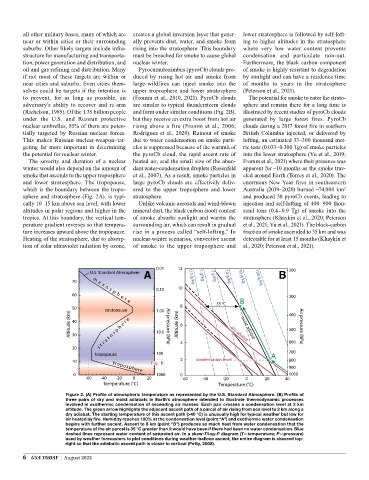
and lower stratosphere. The tropopause, large pyroCb clouds are effectively deliv- enormous New Year fires in southeastern
which is the boundary between the tropo- ered to the upper troposphere and lower Australia (2019–2020) burned ~74,000 km
2
sphere and stratosphere (Fig. 2A), is typi- stratosphere. and produced 38 pyroCb events, leading to
cally 10–15 km above sea level, with lower Unlike volcanic aerosols and wind-blown injection and self-lofting of 400–900 thou-
altitudes in polar regions and higher in the mineral dust, the black carbon (soot) content sand tons (0.4–0.9 Tg) of smoke into the
tropics. At this boundary, the vertical tem- of smoke absorbs sunlight and warms the stratosphere (Khaykin et al., 2020; Peterson
perature gradient reverses so that tempera- surrounding air, which can result in gradual et al., 2021; Yu et al., 2021). The black-carbon
ture increases upward above the tropopause. rise in a process called “self-lofting.” In fraction of smoke ascended to 35 km and was
Heating of the stratosphere, due to absorp- nuclear-winter scenarios, convective ascent detectable for at least 15 months (Khaykin et
tion of solar ultraviolet radiation by ozone, of smoke to the upper troposphere and al., 2020; Peterson et al., 2021).
0.01 12 200
A 0.3 g/kg 1 g/kg 3 g/kg 10 g/kg 30 g/kg 100 g/kg B
U.S. Standard Atmosphere
70
3 g/kg
3 g/kg
0.10 10
60 300
B
m e s o s p h e r e
35 °C
35 °C
35 °C
50 stratopause 1.00 8 400
Altitude (km) 40 s t r a t o s p h e r e 10.0 Air pressure (hPa) Altitude (km) 6 dry adiabat 500 Air pressure (hPa)
30
moist adiabat
moist adiabat
moist adiabat
20 4 600
tropopause 100 A A A 700
condensation levell
condensation leve
10 Fig. Bg. Bg. B 2 condensation level 800
Fi Fi
900
troposphere
10
1000
0 100000 0 1000
-60 -40 -20 0 20 -60 -40 -20 0 20 40
Temperature (°C) Temperature (°C)
Figure 2. (A) Profile of atmospheric temperature as represented by the U.S. Standard Atmosphere. (B) Profile of
three pairs of dry and moist adiabats in Earth’s atmosphere intended to illustrate thermodynamic processes
involved in exothermic condensation of ascending air masses. Each pair crosses a condensation level at 2 km
altitude. The green arrow highlights the adjacent ascent path of a parcel of air rising from sea level to 2 km along a
dry adiabat. The starting temperature of this ascent path (>40 °C) is unusually high for typical weather but low for
air heated by fire. Humidity reaches 100% at the condensation level (point “A”) and exothermic water condensation
begins with further ascent. Ascent to 8 km (point “B”) produces so much heat from water condensation that the
temperature of the air parcel is 35 °C greater than it would have been if there had been no water condensation. Blue
dashed lines represent water content of saturated air. In a skew-T/log-P diagram (T—temperature; P—pressure)
used by weather forecasters to plot conditions during weather-balloon ascent, the entire diagram is sheared top-
right so that the adiabatic ascent path is closer to vertical (Petty, 2008).
6 GSA TODAY | August 2022