
Page 8 - i1052-5173-31-5
P. 8
150 A Foremost to any interpretation of a quanti-
100 Outliers Outliers tative dataset is an assessment of uncertainty.
(wt%) 50 In truth, a datum representing a physical
quantity is not a single scalar point, but rather,
40
O 30 an entire distribution. In many cases, such as
in our workflow, this distribution is implicitly
Al 20 assumed to be Gaussian, an assumption that
10 may or may not be accurate (Rock et al.,
0 1987)—although a simplified distribution
certainly is better than none. The quantifica-
Filtered data B tion of uncertainty in Earth sciences espe-
40 Resampled error x1 6 6
x100
Resampled mean 4 cially is critical when averaging and binning
by a selected independent variable, since
Resampled data density
30
(wt%) 20 3 Count neglecting the uncertainty of the independent
variable will lead to interpretational failures
O 2 that may not be mitigated by adding more
Al 10 1 data. As time perhaps is the most common
0 0 independent variable (and one with a unique
x10 5 5 relationship to the assessment of causality),
x10
4 C incorporating its uncertainty especially is
2 critical for the purposes of Earth history stud-
10 ies (Ogg et al., 2016). An age without an
U (ppm) uncertainty is not a meaningful datum.
Indeed, such a value is even worse than
10 an absence of data, for it is actively mis-
leading. Consequently, assessment of age
uncertainty is one of the most important, yet
10 -3 underappreciated, components of building
400 D accurate temporal trends from large datasets.
200 Filtered data Of course, age is not the only uncertain
x1
100 Resampled error x100 aspect of samples in compiled datasets, and
Resampled mean researchers should seek to account for as
80
Resampled data density
U (ppm) 60 2 Count many inherent uncertainties as possible. Here,
40 1 we propagate uncertainty by using a resam-
pling methodology that incorporates informa-
20 tion about space, time, and measurement
0 0 error. Our chosen methodology—which is by
4000 3500 3000 2500 2000 1500 1000 500 0 no means the only option available to research-
Age (Ma) ers studying large datasets—has the benefit of
preventing one location or time range from
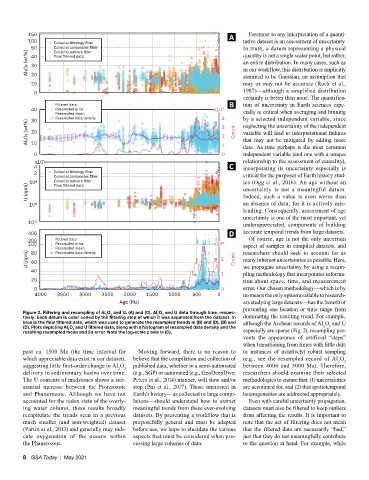
Figure 2. Filtering and resampling of Al O and U. (A) and (C). Al O and U data through time, respec-
2
3
3
2
tively. Each datum is color coded by the filtering step at which it was separated from the dataset. In dominating the resulting trend. For example,
blue is the final filtered data, which was used to generate the resampled trends in (B) and (D). (B) and although the Archean records of Al O and U
2
3
(D). Plots depicting Al O and U filtered data, along with a histogram of resampled data density and the especially are sparse (Fig. 2), resampling pre-
2
3
resulting resampled mean and 2σ error. Note the log-scale y axis in (C).
vents the appearance of artificial “steps”
when transitioning from times with little data
past ca. 1500 Ma (the time interval for Moving forward, there is no reason to to instances of (relatively) robust sampling
which appreciable data exist in our dataset), believe that the compilation and collection of (e.g., see the resampled record of Al O
2
3
suggesting little first-order change in Al O published data, whether in a semi-automated between 4000 and 3000 Ma). Therefore,
3
2
delivery to sedimentary basins over time. (e.g., SGP) or automated (e.g., GeoDeepDive; researchers should examine their selected
The U contents of mudstones shows a sub- Peters et al., 2014) manner, will slow and/or methodologies to ensure that: (1) uncertainties
stantial increase between the Proterozoic stop (Bai et al., 2017). Those interested in are accounted for, and (2) that spatiotemporal
and Phanerozoic. Although we have not Earth’s history—as collected in large compi- heterogeneities are addressed appropriately.
accounted for the redox state of the overly- lations—should understand how to extract Even with careful uncertainty propagation,
ing water column, these results broadly meaningful trends from these ever-evolving datasets must also be filtered to keep outliers
recapitulate the trends seen in a previous datasets. By presenting a workflow that is from affecting the results. It is important to
much smaller (and non-weighted) dataset purposefully general and must be adapted note that the act of filtering does not mean
(Partin et al., 2013) and generally may indi- before use, we hope to elucidate the various that the filtered data are necessarily “bad,”
cate oxygenation of the oceans within aspects that must be considered when pro- just that they do not meaningfully contribute
the Phanerozoic. cessing large volumes of data. to the question at hand. For example, while
8 GSA Today | May 2021