
Page 6 - gt1601
P. 6
2015 GSA PRESIDENTIAL ADDRESS
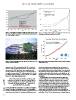
Figure 7. Annual global coal production, 1900–2013 (production data from Figure 9. Estimated world population and production of flint over time,
U.S. Department of Energy and World Coal Association; population data from illustrating peak flint production (from Price, 2013).
U.S. Central Intelligence Agency).
Figure 8. Coal seams near Healy, Alaska, USA, 1999. Seams as thick as 3 m are not Figure 10. Rising CO2 in the atmosphere (from National Oceanic & Atmospheric
uncommon in better coal fields. Administration, 2015).
GSA TODAY | JANUARY 2016 observed rise in CO2 in the atmosphere (Fig. 10). As estimated thorium for nuclear power; neodymium, iron, and boron for
from the calculation below, the amount of CO2 released from high-strength magnets in wind turbines; and terbium and euro-
burning of coal in 2013 would have been enough, even with pium in highly efficient fluorescent light bulbs. Geoscientists will
natural reduction from plant growth, rain, and other processes, also contribute to safe disposal of waste from energy production,
to raise the concentration of CO2 in the atmosphere by ~2.9 parts including evaluating the safety of nuclear waste repositories and
per million by volume (ppmv), a bit more than the recent global injection of CO2 in permeable strata without generating damaging
trend of CO2 increasing ~2 ppmv per year. earthquakes.
(7.823 × 10¹⁵ g coal burned in 2013) × (~0.8 g C/g coal) As all geologists know, the world is literally changing. Plate
× (3.6642 g CO2/ g C)/(5.15 × 1021 g air in the atmosphere) tectonics slowly moves the ocean floors and continents. Erosion
× (28.97 g air)/(mole air) × (1 mole CO2)/(44.0095 g CO2) sculpts the landscape. Volcanism modifies climate. What has
changed, though, in my lifetime, is that we are now measuring
× 106 ppmv CO2/(mole CO2/mole air) = ~2.9 ppmv CO2 many of the changes directly. With the advent of the global posi-
potentially added to the atmosphere tioning system (GPS), we are now able to accurately measure how
the world is changing, with a myriad of applications from basic
Geoscientists will have opportunities to contribute to mitigation science to natural hazards. We are able to directly measure
through exploration and development of the mineral resources tectonic rates of change (Fig. 11), which are increasingly being
needed for renewable and carbon-minimal energy production and used in earthquake-hazard assessment and communication to the
more efficient use of electricity. Examples include uranium and public (Figs. 12 and 13). Such communication is slowly helping to
6