
Page 4 - gt1601
P. 4
2015 GSA PRESIDENTIAL ADDRESS
The world is changing
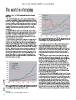
GSA TODAY | JANUARY 2016 Jonathan G. Price, LLC, 2210 Andromeda Way, Reno, Nevada Figure 2. Annual global gold production, 1900–2014 (production data from
89509, USA U.S. Geological Survey and U.S. Bureau of Mines; population data from U.S.
Central Intelligence Agency; updated from Price, 2013).
The world is changing. Our science is increasingly global, as we
recognize the challenges of understanding interconnected Earth A somewhat similar situation is illustrated by gold production
systems, meeting the rising global demand for mineral and energy (Fig. 2). Although gold has many industrial uses (vital for
resources, handling tradeoffs regarding sustainable development, conducting electricity in computers and cell phones and in
and reducing the risks of natural disasters that impact the global reflecting heat), its primary use is as money, either in the form of
economy. The geosciences are vital to meeting these societal bullion, coins, or, in much of the world, jewelry. Since 1900, gold
challenges. The future is bright for the geosciences, from many production has increased by a factor of seven, and per capita
perspectives. consumption has fluctuated but overall increased by a factor of
about two.
Demand is high for nearly every mineral and energy resource.
This high demand provides many opportunities for geoscientists Mine production of gold in 2014 reached the historically high
to contribute throughout the life cycles of these resources (from amount of 2,860 metric tons, according to the U.S. Geological
exploration and mining to reclamation and recycling) and to Survey (2015). For the geological community, this is a staggering
continually improve environmentally responsible and economi- amount. In comparison, the Carlin trend in Nevada (Fig. 3),
cally sustainable extractive activities. one of the top gold-mining areas in the world, has produced
~2,500 metric tons of gold (worth approximately US$100 billion
Global production of copper (Fig. 1) illustrates the high demand. at last year’s average price) in its entire history (including modern-
Copper is vital in modern society, primarily as a conductor of day production after the discovery of the Carlin deposit in 1961).
electricity. Demand is high in part because the world population Assuming that mine production, from hundreds of mines
continues to rise and in part because per capita consumption is throughout the world, continues at this rate, geoscientists will
also rising (illustrated in Fig. 1 as annual mine production divided need to find the equivalent of at least one new Carlin trend each
by population). More people want the conveniences that electricity year to keep up with global demand.
provides—lighting, heating, motors, refrigerators, computers, etc.
Since 1900, world population has increased approximately four- We are in the midst of the biggest gold-mining boom in history,
fold, whereas copper production has increased by a factor of 38, both globally (Fig. 2) and in the United States (Fig. 4). The current
and per capita consumption has risen nine-fold. Although some boom has exceeded previous booms in terms of total production,
ups and downs (due to recessions and wars) in production are peak annual production, and longevity. Yet the world of gold mining
apparent, the trends are clearly toward more copper mined and has changed. For decades the Witwatersrand in South Africa
more use per person each year. dominated global gold production, but in 2007, China overtook
South Africa to become the number 1 producer (Fig. 5). China is
Figure 1. Annual global copper production, 1900–2014 (production data from the world’s most populous country, with 19% of the global popu-
U.S. Geological Survey and U.S. Bureau of Mines; population data from U.S. lation (Fig. 6), and if one assumes even geographic distribution of
Central Intelligence Agency; updated from Price, 2013). mineral resources, one might expect China to produce roughly
19% of most commodities. China’s growth in the last decade has
GSA Today, v. 26, no. 1, doi: 10.1130/GSAT-15PresAdrs.1.
4