
Page 5 - gt1601
P. 5
2015 GSA PRESIDENTIAL ADDRESS
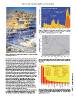
Figure 4. Gold production in the United States and in Nevada, 1835–2014 (data
from Dobra, 2002, U.S. Geological Survey, U.S. Bureau of Mines, and Nevada
Bureau of Mines and Geology; updated from Price, 2013).
Figure 3. Photograph of the Carlin East pit and portal in 2000, Newmont Mining
Corporation, Nevada, USA.
been dramatic. To meet its demand for mineral resources needed Figure 5. Annual gold production by major producing countries, 1930–2014 GSA TODAY | www.geosociety.org/gsatoday
for domestic infrastructure, domestic consumption, and exports (data from U.S. Geological Survey and U.S. Bureau of Mines; updated from
of products, China far exceeds 19% of global production for many Price, 2013).
mineral commodities (Fig. 6). That is, the world of mining has
changed, with China far exceeding other countries in production. Figure 6. Most populous countries and China’s percentage of global production
for selected commodities (data from U.S. Geological Survey, U.S. Department
China also leads the world in coal production, with 46% of the of Energy, and U.S. Central Intelligence Agency; EU—European Union;
global total in 2013. Like most of the other mineral resources, updated from Price, 2013).
global annual coal production has been rising in recent years
(Fig. 7), largely due to China’s demand. Coal is used primarily in
the generation of electricity, but metallurgical coal is also used in
the production of steel, for which China produced 50% of the
global supply in 2014. Annual global coal production (~7.8 billion
metric tons in 2013) is significant in terms of both impacts to the
land and to the atmosphere. Assuming an average coal-seam
thickness of 3 m (Fig. 8), the global amount of coal production
would cover an area of ~1860 km2. There are indications that
China is slowing down its coal production, in part due to the
health hazards of air pollution. With changing technology in
energy production, it is likely that we will one day see a peak in
coal production, much like the peak in flint production (Fig. 9),
which was caused by technological advances.
Climate is changing, with many opportunities for geoscientists
to contribute to mitigation and adaptation. It seems clear that
the burning of coal and other fossil fuels is contributing to the
5