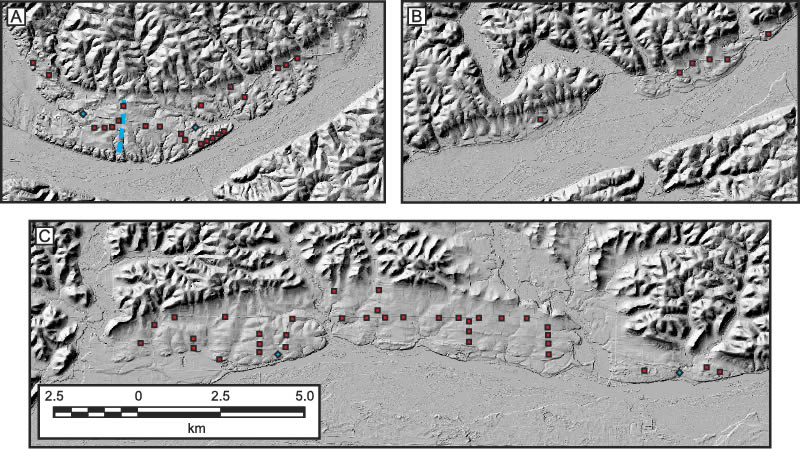
Figure 2.
Detailed LiDAR-derived hillshade maps of the three remnant segments of the Bridgeport strath as identified in Figure 1, showing (A) the westernmost segment; (B) the central segment; and (C) the easternmost segment. Red squares identify locations of Geoprobe coring to determine bedrock surface elevations. Blue diamonds identify locations where Paleozoic bedrock crops out, verifying that the surface is a strath terrace. Blue dashed line in (A) identifies the location of the Bridgeport moraine, which represents the farthest west extent of a pre-Illinoian glaciation that advanced out of Minnesota and Iowa (Knox and Attig, 1988). All images are shown at the same scale.