Page 6 - i1052-5173-27-7
P. 6

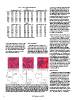
Table 1. Precision of bulk composition data                                                                                                                                             in a system, it will have a disproportionate
                                                                                                                                                                                                            effect on bulk composition if the size of
                              Basalt                                                                                                                                                                        that mineral is close to the beam size. In
                                                                                                                                                                                                            the Shasta basalt experiments, olivine is
       Sampling density = 10  Sampling density = 50                Sampling density = 100                                                                                                                   the major MgO host and therefore controls
                                                                                                                                                                                                            the bulk MgO content. As grain size
       0.25 1.0 2.5           0.25 1.0 2.5                         0.25 1.0   2.5                                                                                                                           increases relative to beam size, errors asso-
                                                                                                                                                                                                            ciated with predicted MgO content get
SiO2   0.01*  0.02  0.03      0.00 0.01      0.02                  0.00 0.01  0.02                                                                                                                          larger at a much faster rate than those of
Al2O3  0.05   0.05  0.20      0.02 0.07      0.11                  0.01 0.05  0.05                                                                                                                          the other oxides (Fig. 3) due to dispropor-
TiO2   0.06   0.11  0.19      0.01 0.07      0.15                  0.03 0.07  0.15                                                                                                                          tionate undersampling of the coarse-grained
FeO    0.06   0.09  0.19      0.01 0.06      0.10                  0.01 0.04  0.07                                                                                                                          olivine. Other oxides in this basalt (CaO,
                                                                                                                                                                                                            Al2O3, SiO2) do not show similar behavior
MgO 0.10 0.22 0.42            0.03 0.13 0.26                       0.03 0.12 0.13                                                                                                                           (Fig. 3). They occur in comparable amounts
                                                                                                                                                                                                            among all mineral phases (plagioclase,
MnO 0.07 0.07 0.20            0.00 0.07 0.06                       0.00 0.07 0.07                                                                                                                           augite, glass), so representative sampling
                                                                                                                                                                                                            of them is not as critical to returning the
CaO 0.04 0.12 0.12            0.01 0.05 0.09                       0.01 0.03 0.06                                                                                                                           true bulk rock composition.

Na2O 0.04 0.07 0.16           0.01 0.06      0.12                  0.01 0.05  0.05                                                                                                                          Number and Placement of Analysis Spots
K2O 0.04 0.11 0.20            0.02 0.08      0.15                  0.02 0.06  0.14
                                                                                                                                                                                                              From a statistical viewpoint, minerals in
                                  Dacite                                                                                                                                                                    rocks can be viewed as randomly distrib-
                                                                                                                                                                                                            uted unless there is textural evidence to the
       Sampling density = 10  Sampling density = 50                Sampling density = 100                                                                                                                   contrary (Figs. 2A–2C). As the number of
                                                                                                                                                                                                            analyses increases, calculated bulk compo-
       0.25 1.0 2.5           0.25 1.0 2.5                         0.25 1.0   2.5                                                                                                                           sition gets closer to the true bulk value
                                                                                                                                                                                                            (Figs. 4A–4C; Supplementary Table).
SiO2 0.01 0.03 0.05           0.01 0.02      0.03                  0.00 0.01  0.02                                                                                                                          Analytical precision increases with sam-
                              0.01 0.05      0.04                  0.01 0.03  0.05                                                                                                                          pling density as well, especially for minor
Al2O3 0.02 0.07 0.08          0.03 0.12      0.23                  0.03 0.06  0.15                                                                                                                          elements or those concentrated in a single
                              0.02 0.08      0.16                  0.02 0.05  0.12                                                                                                                          phase (i.e., MgO as noted above) (Table 1).
TiO2   0.06 0.24 0.25                                                                                                                                                                                       In our modeled rocks, ~6–10 analyses are
                                                                                                                                                                                                            necessary for calculated bulk composition
FeO 0.06 0.18 0.18                                                                                                                                                                                          to fall within a 1 error envelope of the
                                                                                                                                                                                                            real composition for most fine-grained
MgO 0.13 0.38 0.47            0.06 0.15 0.39                       0.05 0.13 0.25                                                                                                                           samples (grain size < beam size) (Figs. 4A–
                                                                                                                                                                                                            4C). This is definitely not the case for
MnO 0.00 1.00 1.00            0.00 0.00 1.00                       0.00 0.00 1.00                                                                                                                           coarse-grained samples (beam size > grain
                                                                                                                                                                                                            size; Fig. 4D), where sampling of even 100
CaO 0.07 0.15 0.22            0.03 0.08 0.11                       0.02 0.07 0.12                                                                                                                           locations does not reproduce calculated
                                                                                                                                                                                                            bulk compositions within the 1 error
Na2O 0.03 0.05 0.09           0.01 0.03 0.05                       0.01 0.02  0.04                                                                                                                          envelope (Table 1).
                                                                              0.09
K2O 0.05 0.11 0.20            0.02 0.06 0.08                       0.01 0.05

*Relative standard deviation (standard deviation/measured value).

will sample all phases in a rock in correct  Phase Assemblage
proportions. In such cases, returned wt%
oxide values do not accurately represent       Although grain size is a significant
the bulk rock (Supplementary Table; Figs.    determining factor in producing accurate
2D–2F), and the RSDs associated with         bulk compositions, the chemistry of con-
such analyses are so large as to render      stituent minerals and glasses in the phase
them meaningless (Table 1).                  assemblage may also play roles. If a single
                                             phase contains the majority of an element

Figure 2. (A–C): Modeled basaltic “rocks” of varying grain size: red—glass, blue—olivine, purple—                                                                                                           Melt Properties
plagioclase, and pink—augite. Black squares are the sampling areas (50). Grain size relative to
beam size increases to the right; beam size remains constant at 40 pixels. (A) Grain size = 10 pixels.                                                                                                        Geologists are increasingly investigating
(B) Grain size = 50 pixels. (C) Grain size = 150 pixels. (D–F): Comparison of true versus calculated                                                                                                        chemical phenomena that occur at smaller
bulk composition as grain size increases relative to beam size, with grain size < beam size (0.25),                                                                                                         scales than the routine 1 m EPMA mea-
grain size ≈ beam size (1.25), and grain size > beam size (2.5). The solid line denotes where grain size                                                                                                    surement, such as measurement of iron
and beam size are of equal size. Dashed lines represent the true electron probe microanalysis–                                                                                                              redox state by X-ray absorption spectros-
determined bulk composition. Circles are the calculated values. (D) MgO. (E) Al O . (F) CaO.                                                                                                                copy (XAS: spot size = 1000–5000 nm)
                                                                                                                                                                                                            and STEM-EELS (spot size = 0.1–0.2 nm).
                                                                                                                                                                                                        23  To illustrate the resulting issues of scale,
                                                                                                                                                                                                            we calculated Fe3+/Fe2+ ratios for a basaltic
                                                                                                                                                                                                            melt (BAS-2; Dyar et al., 2016) homog-
                                                                                                                                                                                                            enized under oxidizing conditions. To sim-
                                                                                                                                                                                                            ulate STEM-EELS measurements, a beam/
                                                                                                                                                                                                            sample order size ratio of 0.1 was used (beam
                                                                                                                                                                                                            size = 10 pixels; order size = 100 pixels;

6 GSA Today | July 2017
   1   2   3   4   5   6   7   8   9   10   11