Introduction
Basin-scale sediment distribution and its resulting stratigraphy are widely believed to be controlled by
allogenic controls including changes in sediment supply, eustasy, and tectonics (e.g., Jervey, 1988; Heller et
al., 1993). Changes in stratigraphy are often linked to variations associated with one or a combination of these
allogenic controls; however, fewer studies have considered the effects that local topographic development can
have in the imprinting of the stratigraphic record. In basins affected by salt tectonics, allogenic signatures
within the stratigraphic record are overprinted by the influence of salt movement, and, as a consequence,
decoupling the effects of sediment supply, eustasy, conventional tectonism, and salt tectonics becomes
difficult. We believe that illustrating these relationships is important because salt basins are common in many
regions of the world, including the Gulf Coast region of the United States and the deep-water Gulf of Mexico.
Surprisingly, most geoscientists working outside the realms of industry or applied research have little exposure
to knowledge associated with the complexities that salt basins pose when trying to untangle basin evolution and
fundamental sedimentological, stratigraphic, and tectonic processes. By discussing some aspects of these
complexities, using physical and numerical models coupled with observations from a real case study, we hope to
bring attention to the importance of studying salt tectonic process and sediment interactions within salt basins
as an important and often overlooked component of Earth’s evolution.
In this study we present a novel methodology integrating inputs derived from physical modeling with landscape
numerical modeling. The integrated model simulates the surface and stratigraphic evolution of salt-controlled
basins within the context of a continental-scale source-to-sink (S2S) system covering the entire sedimentary
profile from the upstream sediment source in the continental realm to the sediment sink in the marine realm.
Such an approach benefits from using surfaces derived from a physical model that simulates the evolution of a
salt basin containing numerous salt diapirs. Time steps of vertical movements derived from the physical model
are the input for the numerical models. The input parameters from the physical model responded to well-known
laboratory conditions constraining the evolution of the salt-tectonic topography (e.g., Dooley et al., 2013, and
Supplemental Material1) and guiding the numerical approach. We use the numerical modeling approach to
understand: (1) the level of influence that salt tectonics can insert in the development of sediment routing
systems within the sink domain, and (2) how the evolution of local topography within salt basins influences the
vertical development of stratigraphic patterns. Our study emphasizes the importance of reconstructing the
paleo-topography of ancient depositional systems to better understand the imprinting of the stratigraphic
section while taking into consideration the impact of an S2S configuration. Finally, we used learnings derived
from this integration between physical and numerical models to establish parallels with observations from the
Lower Cretaceous Mississippi Salt Basin (Fig. 1) to demonstrate the validity of the analogy between the modeling
effort and a real case scenario.
 Figure
1
Figure
1
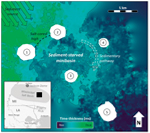
Time-thickness map from a Lower Cretaceous unit in the Mississippi Salt Basin (Thieling and Moody, 1997; Johnson
et al., 2006). Regional sediment source is from the northwest. Numbers 1 to 5 in white areas denote locations of
salt domes. Domes 1 and 2 acted as a salt-cored high blocking sedimentary input. A clockwise oriented
sedimentary pathway developed around Dome 2. Contour interval is 50 ms. Map derived from seismic data courtesy
of CGG. MI—Mississippi; LA—Louisiana.
Methodology
We integrated the results from a physical model and an S2S numerical model to better understand the sediment
routing in salt-bearing basins. The physical model was designed to explore salt-tectonic processes within a
salt-bearing basin punctuated by numerous salt structures similar to the ones observed in the Campeche Basin of
the southern Gulf of Mexico (e.g., Davison, 2021, and references therein). It is important to highlight that
results from physical models (aka. sandbox models) are agnostic, meaning that observations can be applied to
other settings where particular processes form similar structures. Moreover, physical models of salt tectonics
are not meant to exactly duplicate characteristics observed in a particular basin; instead, they are primarily
designed to help understand processes associated with the formation of certain geological features (e.g., Dooley
et al., 2012; Ge et al., 1997; Rowan and Vendeville, 2006).
It should be stressed that this first iteration of our numerical model doesn’t take into consideration flexural
subsidence as a response to sediment loading, taking only into consideration input from the physical model. This
approach was adopted by design, given that we wanted our numerical models to start from a simpler baseline to
progressively increase levels of complexity at later stages. We will incorporate sediment loading in our next
iteration of numerical models, and we will compare results from different runs to weigh the influence of
sediment loading versus pre-set geometric configurations exclusively derived from the physical model.
The physical model utilized well-documented modeling materials, with a silicone polymer acting as our salt
analog, and a mixture of silica sands and spherical cenospheres to simulate the siliciclastic overburden (e.g.,
Reber et al., 2020, and references therein). Salt diapirs and pillows with varying geometries were seeded by
differential loading, as is typical for this style of physical modeling (e.g., Rowan and Vendeville, 2006;
Dooley et al., 2013), and gradually grew upward as a series of diapirs, resulting in the localized drawdown of
the autochthonous salt layer to feed these growing salt structures, leading to the formation of numerous
salt-withdrawal basins (minibasins; Fig. 2A). As the diapirs grew, some linked as composite structures, forming
salt-cored highs with the greatest structural relief above the crests of the original diapirs (Fig. 2A). The S2S
numerical model uses height-change data through time from the physical model (i.e., the rates of subsidence and
uplift, Fig. 2A) to constrain the evolution of the salt-related topography. The original parameters extracted
from the physical model are upscaled to fit a continental-scale S2S system (Figs. 2A–2B). The pyBadlands
software package is employed to simulate the evolution of topography and stratigraphy (Salles et al., 2018). The
detailed description of the model parameters and governing equations of the landscape numerical modeling can be
found in the supplemental material (see footnote 1). Even though the integrated physical and numerical modeling
method proposed in this study is novel, the employed workflows of physical modeling of salt tectonics and S2S
numerical modeling are well practiced in recent studies (e.g., Dooley et al., 2020; Duffy et al., 2021; Reber et
al., 2020; Zhang et al., 2020; Ding et al., 2019).
 Figure
2
Figure
2
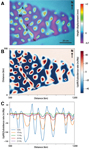
(A) Height displacements of our physical model from time-lapse stereo surface recordings and digital image
correlation software. (B) Three-dimensional distribution of uplift/subsidence rates at 5 m.y. (upscaled from the
data presented in Fig. 3A). (C) Cross section at basin axis showing the rates of uplift and subsidence at 5, 10,
15, 20, and 25 m.y. The cross section captures the high subsidence/uplift rates typically associated with the
initial remobilization of in situ salt (blue and yellow lines for 5 and 10 m.y., respectively) versus later
phases of evolution when most of the salt has already been remobilized (green, red, and purple for 15, 20, and
25 m.y., respectively). These trends are observed both in physical models and real case studies in the
subsurface including the Mississippi Basin example that is presented in this work (see Fig. 1). Salt-cored highs
are indicated by letters A and B in the map views, sedimentary pathways are indicated by letters M and N, and X
represents location of starved minibasins.
The simulation time of the S2S numerical modeling is 25 m.y. The length and width of the entire numerical model
from S2S are 1200 km and 500 km, respectively. The source domain is 250 km long with an initial 200-m-high
topography and a constant uplift rate at 40 m/m.y. (Fig. 3). The source domain supplies sediments into the basin
through a 250-km-long transfer zone that connects with a 700-km-long sink domain. The time duration, dimensions,
and uplift rates used in the numerical model were defined based on analogies between the physical model and
observations from the Campeche Basin (e.g., Davison, 2021).
 Figure
3
Figure
3
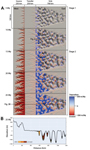
(A) Erosion/deposition maps of the source, transfer, and sink domains at 5, 10, 15, 20, and 25 m.y. Stage 1
(0–15 m.y.), active salt deformation controls basin accommodation and sediments infill the proximal minibasins.
Stage 2 (15–25 m.y.) sedimentary pathways (M and N) bypass sediments around salt-cored highs A and B. Parts of
minibasin X remain sediment starved. (B) Cross section along northern end of minibasin X showcasing modified
stratigraphic patterns (see Fig. 4).
The salt-tectonic movement within the sink domain in the numerical model is constrained by topographic inputs
from the physical model by means of time-lapse stereo surface recordings and associated DIC (digital image
correlation) software that captured incremental surface height changes (Fig. 2).
Finally, after obtaining results from our numerical model, we compare observations to a real subsurface case
study in the Mississippi Salt Basin. The location of the 3-D seismic reflection survey that sourced the
interpretations is shown in Figure 1. The prestack time-migrated seismic volume is situated over the
east-central portion of the basin, has an area of ~533 km2, and spans over five salt domes.
Information on data acquisition, processing, and interpretation can be found in the supplemental material (see
footnote 1).
Results
Numerical Model
The numerical simulations showcased an S2S configuration that was active through 25 m.y. with the following
characteristics: (1) sediment supply derived from the uplifting source domain, (2) a sediment transfer domain
that bypassed sediments into the basin, and (3) a distal basin with local topography controlled by the effects
of salt tectonics (Fig. 3 and Animation 2 in the supplemental material). The results reported herein focus on
the description and interpretation of observations made within the sink domain. We use the terms sink and basin
interchangeably.
The topography of the sink domain is defined by two stages of basin evolution. Stage 1 (0–15 m.y.) is
influenced by the rapid rise of salt diapirs and high subsidence rates within proximal parts of the basin, while
Stage 2 (15–25 m.y.) is characterized by a decrease in subsidence and the triggering of sediment bypass toward
distal parts of the basin (Fig. 3). During Stage 1, the subsidence rate was 150 m/m.y.; this generated high
accommodation in the proximal parts of the basin where extrabasinal sediments gradually infilled subsiding
minibasins (Figs. 2 and 3). During Stage 2, subsidence rates fluctuated between 10–50 m/m.y., the proximal
minibasins were already infilled, and sediments bypassed toward the east. Sediments infilled proximal minibasins
during Stage 1 via line-sourced transport from fluvial systems that transited the transfer zone. Two salt-cored
topographic highs (A and B in Fig. 3) partly blocked sediment transport within the sink domain during Stage 2
while proximal minibasins were completely infilled with sediments. During this time, the sediment dispersal
system became point sourced with the development of two sedimentary pathways that delivered sediments into the
central and distal portions of the basin (sediment pathways M and N in Fig. 3). In contrast, the minibasin
located to the east of salt-cored high B (minibasin X, see Figs. 3 and 4) remains sediment starved during Stage
2 as salt-cored topographic highs block the free flow of sediments. Cross sections of basin stratigraphy in
Figure 4 showcase how the minibasins are gradually filled from proximal to distal (see also Animation 2 in the
supplemental material [see footnote 1]). In Stage 1, the depositional dip of strata infilling the minibasins is
to the east, suggesting sediment supply from west to east; however, during Stage 2 the depositional dip reverses
to the west within the central parts of the sink domain (minibasin X), implying an east to west sediment supply
direction (Fig. 4).
 Figure
4
Figure
4
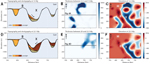
(A)–(C) Cross section, thickness map, and elevation map of a representative interval of Stage 1. B indicates
location of salt-cored high, X location of minibasin, and M location of sedimentary pathway. The proximal
minibasin to the west is completely infilled by this time; minibasin X is underfilled but stratigraphic bedding
is predominantly dipping toward the east, indicating sediment supply from west to east if the cross section is
taken as the only reference point for the interpretation. (D)–(E) Cross section, thickness map, and elevation
map of representative interval of Stage 2. Minibasin X continues to be underfilled, but there is a change on the
dip of stratigraphic beds toward the west, suggesting sediment supply from east to west if the cross section is
taken as the only reference point for the interpretation. The thickness and elevation maps illustrate how
sediment pathways (M) navigate salt-cored highs (B) to infill the northern portions of minibasin X from the
north-northwest during Stage 1 and from the northeast during Stage 2.
Mississippi Salt Basin Case Study
In the Lower Cretaceous interval of the Mississippi Salt Basin, there is a clear heterogeneity of minibasin
infills, with initial regional sediment supply as line-sourced from the northwest (Fig. 1). In this example, the
salt-cored highs of domes 1 and 2 acted as barriers to sediment routing, generating a local sediment starved
minibasin immediately to the southeast. As a consequence, a clockwise sedimentary pathway developed around dome
2 to feed downstream minibasins in an oblique pattern that is divergent from the initial line-sourced
sedimentary input from the northwest (Fig. 1). The diversion of sedimentary sources and pathways as shown in the
Lower Cretaceous Mississippi case study are common in basins affected by salt tectonics and are believed to be
controlled by autogenic effects associated with salt deformation (e.g., Duffy et al., 2020). Despite the known
influence of salt tectonics on the development of stratigraphic patterns, few studies have convincingly
illustrated how these local topographic controls modify sedimentary pathways and how this impacts the rock
record.
Discussion
Tectonic and Local Topographic Controls on Sediment Distribution
Based on the dominant controls, basin evolution was divided into two stages: Stage 1 (0–15 m.y.), which is
controlled by active surface deformation associated with major salt movements; and Stage 2 (15–25 m.y.), which
is controlled by the resultant local topography and sediment bypass toward the east. The rapid rise of
salt-cored highs during Stage 1 (0–15 m.y.), including diapirs and irregularly shaped salt walls, is responsible
for the overall basin configuration through time. During this early stage of basin evolution, the development of
tortuous sedimentary pathways controlled sediment distribution within the proximal minibasins (Fig. 3A). During
Stage 2, the basin relief evolved into a mature minibasin province flanked by salt-cored highs. Sediment
dispersal patterns changed from line-sourced to point-sourced as the main depocenters moved basinward and were
impacted by the local topography. The numerical model clearly illustrates how stratigraphic architectures varied
from proximal to distal portions of the sink domain through time (Fig. 4). Figure 4 records the development of
the stratigraphic infilling at different time steps in the model; the display clearly showcases how
stratigraphic dips vary notably from east-dipping at 15 m.y. to west-dipping within the margins of minibasin X
at 22.5 m.y. These drastic variations in depositional dip could be wrongly described as implying
multidirectional sedimentary sources in real case scenarios where only seismic data is used to perform
interpretations. However, our numerical model demonstrates that it is possible to explain these changes as due
to readjustments of the sedimentary routing system as a response to the evolving mobile-substrate architecture
(Fig. 4).
Using A/S Ratio to Predict Stratigraphic Patterns?
The balance or imbalance status between sediment supply (S) and accommodation (A), referred to as the A/S
ratio, is widely used to predict stratigraphic patterns and serves as a conceptual basis for most sequence
stratigraphic models. The increase of sediment supply or decrease of accommodation promotes regressive
successions and basin fills. However, this theory does not hold when we look at the detailed evolution of
composite minibasin X in the model (Fig. 4). Our results demonstrate that the stratigraphic patterns of
minibasin X are mostly influenced by local, salt-controlled topography, rather than by allogenic changes on
sediment supply or accommodation. The concept is rather simple once the numerical model is interrogated;
however, in real case scenarios, where subsurface data is low quality or scarce and paleo-topographic
reconstructions are not possible, these stratigraphic architectures could be easily misinterpreted. We plan to
increase the complexity of the numerical model in future runs by adding flexural subsidence as a response to
sediment loading; however, the current results demonstrate that paleo-topographic heterogeneities alone can
significantly influence sedimentary pathways and resulting stratigraphic architectures that are preserved in the
rock record.
Physical and Numerical Models as Analogs for Real Case Studies
In terms of basin evolution, in our numerical model Stage 1 can be defined as an underfilled and out of
equilibrium phase while Stage 2 is trending toward equilibrium with proximal minibasins being infilled with
sediments and sedimentary pathways actively developing toward the distal parts of the basin. Minibasin
segmentation and sediment underfilling is still dominant in the distal basin during Stage 2 of our model. In the
Mississippi Salt Basin, reactive and active diapirism took place from the Early–Late Jurassic to the Early
Cretaceous (Johnson et al., 2006). This phase is analogous to Stage 1 in our model, a time period dominated by
strong salt movement and uplift that helped define minibasin placement. A second phase of passive diapirism took
place in the Mississippi Salt Basin from the Early to Late Cretaceous (Johnson et al., 2006), and our analysis
of subsurface data clearly showcases how during this time sedimentary pathways bypassed salt-cored highs
following a trend that diverted from the original line-sourced pattern observed to the northwest (Fig. 1).
Processes operating during the Early to Late Cretaceous in the Mississippi Salt Basin are analogous to Stage 2
of our model where proximal parts of the system are infilled by sediments while new sedimentary influx is
rerouted around diapirs or salt-cored highs toward the distal basin (Figs. 1 and 3).
Conclusions
Our modeling results suggest that: (1) salt tectonics plays a key role in setting up the basin configuration
and determining the sediment routing within the sink domain, (2) the evolution of local salt-related topography
strongly controls the stratigraphic patterns within individual minibasins, and (3) it is possible to use
physical and numerical models as analogs for real case subsurface case studies. The dramatic changes of
stratigraphic patterns within a minibasin don’t need to be linked to allogenic controls and can simply reflect a
local response to salt tectonics. Our study emphasizes the importance of reconstructing paleotopography to
understand sediment routing systems, especially in basins that developed above mobile substrates such as salt.
Our methodology of integrating physical tectonic modeling and S2S numerical modeling provides new ideas on how
to quantitatively predict the stratigraphic patterns preserved within salt-bearing basins. It is our intention
to continue increasing the complexity of the numerical model by incorporating flexural subsidence as a response
to sediment loading in our next batch of models. Salt tectonics, and the geological processes that operate
within salt-bearing basins, have been predominantly the subject of study of geoscientists working in industry
and applied research given the economic relevance that these basins have for oil and gas exploration. The
overemphasis on proprietary resource assessment within these basins has left a gap in the understanding of some
of the fundamental processes operating in salt-bearing basins that impacted Earth’s evolution and therefore
there is a need to pursue additional fundamental research using a more academic approach.
Acknowledgments
This work was funded and directed by the State of Texas Advanced Resource Recovery (STARR) program in
collaboration with the Applied Geodynamics Laboratory (AGL) consortia at the Bureau of Economic Geology, Jackson
School of Geosciences at The University of Texas at Austin. Seismic data courtesy of CGG. We are grateful to
Schlumberger for Petrel and to Eliis for Paleoscan University Grant software. We are also grateful for comments
by two anonymous reviewers. Publication was authorized by the director of the Bureau of Economic Geology.
References Cited
- Davison, I., 2021, Salt tectonics in the Sureste Basin, SE Mexico: Some implications for hydrocarbon
exploration, in Davison, I., Hull, J.N.F., and Pindell, J., eds., 2021, The Basins, Orogens and
Evolution of the Southern Gulf of Mexico and Northern Caribbean: Geological Society, London, Special
Publication 504, p. 147–165, https://doi.org/10.1144/SP504-2019-227.
- Ding, X., Salles, T., Flament, N., Mallard, C., and Rey, P.F., 2019, Drainage and sedimentary responses to
dynamic topography: Geophysical Research Letters, v. 46, no. 24, p. 14,385–14,394,
https://doi.org/10.1029/2019GL084400.
- Dooley, T.P., Hudec, M.R., and Jackson, M.P.A., 2012, The structure and evolution of sutures in
allochthonous salt: AAPG Bulletin, v. 96, no. 6, p. 1045–1070, https://doi.org/10.1306/09231111036.
- Dooley, T.P., Jackson, M.P.A., and Hudec, M.R., 2013, Coeval extension and shortening above and below salt
canopies on an uplifted, continental margin: Application to the northern Gulf of Mexico: AAPG Bulletin, v. 97,
no. 10, p. 1737–1764, https://doi.org/10.1306/03271312072.
- Dooley, T.P., Hudec, M.R., Pichel, L.M., and Jackson, M.P.A., 2020, The impact of base-salt relief on salt
flow and suprasalt deformation patterns at the autochthonous, paraautochthonous and allochthonous level:
Insights from physical models, in McClay, K.R., and Hammerstein, J.A., eds., Passive Margins:
Tectonics, Sedimentation and Magmatism: Geological Society, London, Special Publication 476, p. 287–315,
https://doi.org/10.1144/SP476.13.
- Duffy, O.B., Fernandez, N., Peel, F.J., Hudec, M.R., Dooley, T.P., and Jackson, C.A.-L., 2020, Obstructed
minibasins on a salt-detached slope: An example from above the Sigsbee canopy, northern Gulf of Mexico: Basin
Research, v. 32, no. 3, p. 505–524, https://doi.org/10.1111/bre.12380.
- Duffy, O.B., Dooley, T.P., Hudec, M.R., Fernandez, N., Jackson, C.A.-L., and Soto, J.I., 2021, Principles of
shortening in salt basins containing isolated minibasins: Basin Research, v. 33, no. 3, p. 2089–2117,
https://doi.org/10.1111/bre.12550.
- Ge, H., Jackson, M.P.A., and Vendeville, B.C., 1997, Kinematics and dynamics of salt tectonics driven by
progradation: AAPG Bulletin, v. 81, p. 398–423.
- Heller, P.L., Burns, B.A., and Marzo, M., 1993, Stratigraphic solution sets for determining the roles of
sediment supply, subsidence, and sea level on transgressions and regressions: Geology, v. 21, no. 8, p.
747–750, https://doi.org/10.1130/0091-7613(1993)021<0747:SSSFDT>2.3.CO;2.
- Jervey, M.T., 1988, Quantitative geological modeling of siliciclastic rock sequences and their seismic
expression, in Wilgus, C.K., Hastings, B.S., Posamentier, H., Van Wagoner, J., Ross, C.A., and
Kendall, C.G.S.G., eds., Sea-Level Changes: An Integrated Approach: Society of Economic Paleontologists and
Mineralogists, p. 47–69, https://doi.org/10.2110/pec.88.01.0047.
- Johnson, J.R., Jr., Meylan, M.A., and Ufnar, D.F., 2006, Evolution of a Salt Diapir within the Mississippi
Salt Basin, USA: Interaction of Salt Migration and Sediment Deposition: Gulf Coast Association of Geologic
Societies Transactions, v. 56, p. 309–322.
- Reber, J.E., Cooke, M.L., and Dooley, T.P., 2020, What model material to use? A review on rock analogs for
structural geology and tectonics: Earth-Science Reviews, v. 202, p. 103–107,
https://doi.org/10.1016/j.earscirev.2020.103107.
- Rowan, M.G., and Vendeville, B.C., 2006, Foldbelts with early salt withdrawal and diapirism: Physical model
and examples from the northern Gulf of Mexico and the Flinders Ranges, Australia: Marine and Petroleum
Geology, v. 23, p. 871–891, https://doi.org/10.1016/j.marpetgeo.2006.08.003.
- Salles, T., Ding, X., and Brocard, G., 2018, pyBadlands: A framework to simulate sediment transport,
landscape dynamics and basin stratigraphic evolution through space and time: PLoS One, v. 13, no. 4, e0195557,
https://doi.org/10.1371/journal.pone.0195557.
- Thieling, S.C., and Moody, J.S., 1997, Atlas of shallow Mississippi salt domes: Mississippi Department of
Environmental Quality Office of Geology, Bulletin 131, 332 p.
- Zhang, J., Sylvester, Z., and Covault, J., 2020, How do basin margins record long-term tectonic and climatic
changes?: Geology, v. 48, no. 9, p. 893–897, https://doi.org/10.1130/G47498.1.