Introduction
Ongoing climatic change with rising atmospheric greenhouse gases (Yan et al., 2016) is disproportionally
affecting tropical regions with sterilizing heat waves (Mora et al., 2017) and polar regions with
disappearing sea ice (Kwok, 2018), but is less apparent in the American Midwest, thus allowing
skepticism of global warming science (Wallace et al., 2014). Nevertheless, Midwestern cities and
agriculture have been progressively ravaged by flooding (Fosu et al., 2018). Steadily increased floods
and general level (U.S. Army Corps of Engineers, 2019) of the Mississippi River (Fig. 1A) have been
independent of local climatic changes in precipitation and temperature (National Oceanographic and
Atmospheric Administration, 2019a), which have remained surprisingly flat (Fig. 1B). Nor can increases
in farmed areas be blamed for rising flood levels, because Midwestern cultivated acreage reached a
plateau between 1900 and 1960 (Clausen, 1979; Sohl et al., 2016; Andersen et al., 1996; U.S. Department
of Agriculture Statistics Service, 2019), and has declined slightly since then (Fig. 1C).
 Figure
1
Figure
1
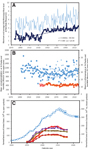
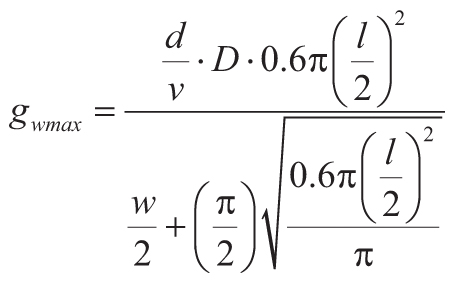
The paradox of rising water in the Mississippi River, but little change in climate or land use: (A)
maximum and mean annual water level of the Mississippi River at Hannibal, Missouri (U.S. Army Corps of
Engineers, 2019); (B) mean annual precipitation (mm) and mean annual temperature (°C) at Hannibal
(crosses) and St. Charles (solid symbol), Missouri (National Oceanographic and Atmospheric
Administration, 2019a); (C) area of farmed land in United States (Sohl et al., 2016; U.S. Department of
Agriculture Statistics Service, 2019: millions of hectares, open symbols) and in five Minnesota counties
of St. Croix watershed (Andersen et al., 1996; thousands of hectares, closed symbols: top to bottom,
Polk, St Croix, Pierce, Chisago, and Washington counties).
Flooding is a long-term and direct response to rising atmospheric CO2 concentrations of much
greater consequence in mid-latitudes than temperature increases, and it has been observed for decades.
Deciduous trees adapt to rising CO2 annually by developing fewer stomates on spring leaves,
because adequate CO2 for photosynthesis can be obtained by reduced air intake (Sugano et al.,
2010; Chater et al., 2015). Fewer stomates also reduce plant transpiration of water, so that more
precipitation runs off in rivers and floods (Betts et al., 2007). The relationship between
CO2 and stomatal density has been known for some time (Woodward, 1987), and there have been
many attempts at quantifying the relationship (Royer et al., 2001; Retallack, 2001, 2009; Barclay and
Wing, 2016; McElwain and Steinthorsdottir, 2017). Here we update quantification of stomatal response to
atmospheric CO2 inferred from herbarium specimens of Ginkgo biloba with an
unprecedented data set ranging from leaves picked in 1754 (Fig. 2) through the definitive upturn of
CO2 in the early twenty-first century (Fig. 3A). Such studies have been the basis for
determining CO2 levels from the distribution of stomates on fossil leaves (Retallack, 2001,
2009) and also for showing the link between greenhouse crises and flooding in deep time
(Steinthorsdottir et al., 2012). A single collection of fossil or herbarium leaves determines global
CO2 concentration with a resolution of weeks because the atmosphere is well mixed on such
time scales, as illustrated by seasonal variation (±4 ppm CO2) between rising values with
autumn leaf shedding and drawdown by photosynthetic initiation as leaves unfurl in spring (National
Oceanographic and Atmospheric Administration, 2019a). Concentrations of atmospheric CO2 are
sensed by stomatal ion channels, which direct gene expression for stomatal density in the developing
leaf for that year (Sugano et al., 2010; Chater et al., 2015). In deciduous plants like Ginkgo
and oak (Quercus), stomatal index reflects spring time CO2 for the year in which
that leaf formed. Ginkgo has been a favorite for such studies because of its unusually long
fossil record, and so has the highest quality data (Barclay and Wing, 2016; Retallack and Conde, 2020).
Comparable records have been obtained from oak (Quercus) and many other species of leaves
(Lammertsma et al., 2011). The relationship between stomatal density and atmospheric CO2
varies with different species, but Quercus and Ginkgo have a similar response (Fig.
3B–3C).
 Figure
2
Figure
2
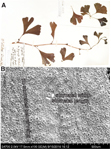
Stomates from leaves of
Ginkgo picked in 1754 from Deshima, Japan. Large images with ~600
stomates and also non-stomatiferous areas below veins were counted to ascertain total leaf conductance.
Pressed leaves from Kew Herbarium and scanning electron microscopy image courtesy of Chrissie Pritchard.
 Figure
3
Figure
3
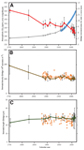
Changes in
Ginkgo stomatal parameters since 1754: (A) observed (National Oceanographic and
Atmospheric Administration, 2019b) and inferred from ice cores (Lüthi, et al., 2008: before 1955)
atmospheric CO
2, with insignificant error, and declining stomatal index (%) of
Ginkgo (1σ error); (B) stomatal density (stomates·m
–2) of
Ginkgo (1σ
error); (C)
stomatal length (μm) of
Ginkgo (1σ error). Stomatal index, density, and length were all
measured from scanning electron microscopy images of herbarium specimens (Retallack and Conde, 2020).
Comparable data scatter in panels (B) and (C) are for
Quercus laurifolia in Florida, from
Lammertsma et al. (2011).
Materials and Methods
We used scanning electron microscopy (SEM) images from herbarium specimens of Ginkgo biloba
(Retallack and Conde, 2020) to refine a time series of historic stomatal parameters (Retallack, 2009),
now extended back to 1754 with specimens in Kew Herbarium picked in Deshima, Japan, and forward with
specimens picked during the dramatic upswing in CO2 over the past decade (Fig. 2). Stomatal
papillae may obscure subsidiary cell walls in cuticle preparations (Barclay and Wing, 2016), but are
clear in SEM images (Fig. 2B). Our method counted images with ~600 cells and 60 stomates in both
stomatiferous and astomatic areas as a proxy for total leaf conductance. Counting smaller areas of
cuticle with only 5–16 stomates (Barclay and Wing, 2016) gives unacceptable systematic errors of
stomatal index: ~20% depending on whether four or five stomates are accidently in the image. Stomatal
bands are distinct from astomatic areas below veins, but we counted both stomatal and subvenal areas to
capture total leaf conductance (Fig. 2B).
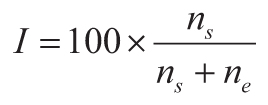
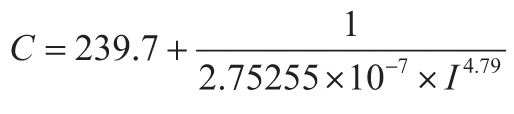
The current stomatal index CO2 paleobarometer (Retallack and Conde, 2020) is based on
atmospheric CO2 (C in ppm) from observations (National Oceanographic and Atmospheric
Administration, 2019b) and ice cores (Lüthi et al., 2008) together with stomatal index (I in %
from Equation 1) from microscopic imaging of herbarium specimens in which number of stomates
(ns) and number of epidermal cells (ne) in the same area are
counted. This inverse relationship (Equation 2) has an algebraically simplified equivalent (Equation 3)
between Gingko stomatal index (I in %) and atmospheric CO2 C in ppm).
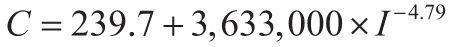
Standard deviations (1σ) of CO2 concentration (in ppm) were calculated by Gaussian error
propagation. Maximum potential transpiration (gwmax in
mol·m–2s–1) can be calculated using Equation 4 (Wolfram Alpha, 2019; Franks et
al., 2014) with additional measurements of stomatal pore length (l, in m), width (w,
in m), and density of stomates (D, as number per m2), as well as physical constants
(Cussler, 1997) of diffusivity of water vapor in air (d = 0.0000282
m–2·s–1) and molar volume of air (v = 0.0224
m–3·mol–1), and 0.6 area correction factor for Ginkgo biloba stomatal
anatomy (Franks et al., 2014). Diffusivity and molar volumes of vapor and liquid are all at 25 °C and 1
atm. All measurements of Ginkgo biloba stomatal density, length, and width are included in the
GSA supplemental material.1
(1)
(2)
(3)
(4)
Our data on plant stomatal response to a well-mixed atmosphere reflects global CO2, but our
assessment of flooding response was limited to upper Mississippi River data derived from public
databases (U.S. Army Corps of Engineers, 2019). This region was also chosen because of available data on
climate change (National Oceanographic and Atmospheric Administration, 2019a) and land use (Clausen,
1979; Sohl et al., 2016; Andersen et al., 1996; U.S. Department of Agriculture Statistics Service,
2019).
Results
Our study is based on measurements of stomatal parameters of herbarium specimens of Ginkgo
biloba extending back to 1754 (Fig. 2). Ginkgo stomatal proxies are similar to those
established for Quercus and other plants (Royer et al., 2001; Lammertsma et al., 2011; Franks
et al., 2014), and the Ginkgo stomatal record is among the best known (Barclay and Wing, 2016;
Retallack and Conde, 2020). Measures of stomatal length and width can be used to calculate maximum pore
area and volume (Franks et al., 2014) and infer water conductance from leaves using the physics of
diffusion through pores (Cussler, 1997). Our records show a secular decline in stomatal index, or
percent stomates versus epidermal cells (Equation 1), of Ginkgo with increasing atmospheric
CO2 as measured since 1955 on Mauna Loa (National Oceanographic and Atmospheric Organization,
2019b) with a base line provided by earlier data (Lüthi et al., 2008) from ice cores (Fig. 3A). The
change in Ginkgo stomatal index over the past 265 years was due more to changes in stomatal
density (Fig. 3B) than to stomatal size (Fig. 3C), and our high-precision data from Ginkgo are
supported by less-accurate data from Quercus (Lammertsma et al., 2011). There is evidence from
fossils that stomatal size also changes when atmospheric CO2 is very high (Retallack, 2009;
Franks and Beerling, 2009), but that threshold was not reached in our observations. Stomatal size also
changes significantly with gene ploidy levels (McElwain and Steinthorsdottir, 2017), but such jumps were
not seen in our data either.
The decline in transpiration for Ginkgo 1829–2015 has been dramatic (Fig. 4A): 0.98 mol
s-1m-2. This is 73 L s-1m-2 of water vapor, or 18 mL
s-1m-2 liquid water, and a reduction by 29%. This substantial decline is a maximal
value realized for only a part of the day in favorable seasons and illumination, but if biorhythms of
the plants remained comparable, as seems reasonable for regions such as the American Midwest with
relatively stable climate (Fig. 1B), a comparable decline in transpiration is likely. Our result also
assumes that the stomatal response of Ginkgo is comparable with that of dominant Midwestern
plants such as Quercus, because both show comparable slopes in stomatal CO2 response
over changing historic CO2 concentrations (Royer et al., 2001). Furthermore, comparable data
from Quercus laurifolia from a Florida swamp (Lammertsma et al., 2011) straddles our data
(Figs. 3B–3C, 4A) but with greater variance due to smaller cell counts. Quercus is a dominant
plant throughout much of the northern hemisphere (Manos et al., 1999). The central Mississippi River had
estimated summer monthly evapotranspiration (Mu et al., 2013) of 90 mm by 2010. The transpiration
decline 1829–2015 is 29%, for a decline since 1829 of 30 mm evapotranspiration, and as much added to
runoff.
 Figure
4
Figure
4
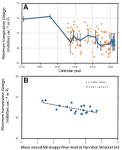
Changes in
Ginkgo transpiration since 1754: (A) reduction in maximum stomatal transpiration
(l·s
–1·m
–2) of
Ginkgo (1σ error) calculated using Equation 4; (B) mean
annual level of
Mississippi River at Hannibal, Missouri, (m) as a function of maximum stomatal transpiration
(l·s
–1·m
–2)
of
Ginkgo. Comparable data in panel (A) from
Quercus laurifolia in Florida is from
Lammertsma et al. (2011).
Rising Waters
Records of Mississippi River levels at Hannibal, Missouri (U.S. Army Corps of Engineers, 2019), go back
to 1888, and since that time, mean annual river levels have risen in proportion to the decline in
maximum transpiration of Ginkgo (Fig. 4B). Flood levels also increased over time, but their
severity has been erratic (Fig. 1A). Other factors promoting flooding include reduced transpiration from
replacement of trees with grasses (Alton et al., 2009; Morton et al., 2015), observed in pollen records
(Sohl et al., 2016), and maintenance of hard surfaces such as roads and parking lots to service
continuously developed acreages (U.S. Department of Agriculture Statistics Service, 2019). In this
regime of rising river and flood levels, planning for the 100-year or other flood recurrence levels is
vain, and non-stationary flood prediction is needed (Vogel et al., 2011). At Hannibal, Missouri, annual
average levels of the river can be expected to rise 2 cm per year for the foreseeable future (Fig. 1A),
even if climate does not finally become significantly more humid, as expected with rise in atmospheric
temperature (Retallack and Conde, 2020). Declining transpiration as a direct response to rising
atmospheric CO2 is an underappreciated factor in flood prediction (Betts et al., 2007).
Acknowledgments
We thank Greg Bothun, Dan Gavin, and Pat Bartlein for stimulating discussions. Jonathan Wynn, Joshua
Roering, and Edward Davis proffered mathematical advice. Chrissie Prychid and Nicola Kuhn provided
scanning electron microscopy images of Ginkgo leaves of the Kew Herbarium picked in 1754 in
Japan. Arne Arneberg provided leaf fragments from the Swedish Natural History Museum picked in 1829 from
“Hortus Botanicus Augustinus,” Amsterdam. Hugo de Boer provided raw data on oak stomatal index from
Florida published by Lammertsma et al. (2011). Sarena Campbell, John Donovan, and Julie Chouinard aided
with scanning electron microscopy.
References Cited
- Alton, P., Fisher, R., Los, S., and Williams, M., 2009, Simulations of global evapotranspiration
using semiempirical and mechanistic schemes of plant hydrology: Global Biogeochemical Cycles,
v. 23, GB4023, https://doi.org/10.1029/2009GB003540.
- Andersen, O., Crow, T.R., and Leitz, S.M., 1996, Transformation of a landscape in the upper
mid-west, USA: The history of the lower St. Croix River valley, 1830 to present: Landscape and Urban
Planning, v. 35, p. 247–267, https://doi.org/10.1016/S0169-2046(96)00304-0.
- Barclay, R.S., and Wing, S.L., 2016, Improving the Ginkgo CO2 barometer:
Implications for the early Cenozoic atmosphere: Earth and Planetary Science Letters, v. 439,
p. 158–171, https://doi.org/10.1016/j.epsl.2016.01.012.
- Betts, R.A., Boucher, O., Collins, M., Cox, P.M., Falloon, P.D., Gedney, N., Hemming, D.L.,
Huntingford, C., Jones, C.D., Sexton, D.M.H., and Webb, M.J., 2007, Projected increase in
continental runoff due to plant responses to increasing carbon dioxide: Nature, v. 448,
p. 1037–1041, https://doi.org/10.1038/nature06045.
- Chater, C., Peng, K., Movahedi, M., Dunn, J.A., Walker, H.J., Liang, Y.K., McLachlan, D.H., Casson,
S., Isner, J.C., Wilson, I., and Neill, S.J., 2015, Elevated CO2-induced responses in
stomata require ABA and ABA signaling: Current Biology, v. 25, p. 2709–2716,
https://doi.org/10.1016/j.cub.2015.09.013.
- Clausen, M., 1979, Forests in the long sweep of American history: Science, v. 204,
p. 1168–1174, https://doi.org/10.1126/science.204.4398.1168.
- Cussler, E.L., 1997, Diffusion: Mass Transfer in Fluid Systems: Cambridge, UK, Cambridge University
Press, 580 p.
- Fosu, B., Wang, S., and Pegion, K., 2018, Synoptic and climate attributions of the December 2015
extreme flooding in Missouri, USA: Water, v. 10, p. 350,
https://doi.org/10.3390/w10040350.
- Franks, P.J., and Beerling, D.J., 2009, Maximum leaf conductance driven by CO2 effects on
stomatal size and density over geologic time: Proceedings of the National Academy of Sciences of the
United States of America, v. 106, p. 10,343–10,347, https://doi.org/10.1073/pnas.0904209106.
- Franks, P.J., Royer, D.L., Beerling, D.J., Van de Water, P.K., Cantrill, D.J., Barbour, M.M., and
Berry, J.A., 2014, New constraints on atmospheric CO2 concentration for the Phanerozoic:
Geophysical Research Letters, v. 41, p. 4685–4694, https://doi.org/10.1002/2014GL060457.
- Kwok, R., 2018, Arctic sea ice thickness, volume, and multiyear ice coverage: Losses and coupled
variability (1958–2018): Environmental Research Letters, v. 13, 105005,
https://doi.org/10.1088/1748-9326/aae3ec.
- Lammertsma, E.I., de Boer, H.J., Dekker, S.C., Dilcher, D.L., Lotter, A.F., and Wagner-Cremer, F.,
2011, Global CO2 rise leads to reduced maximum stomatal conductance in Florida
vegetation: Proceedings of the National Academy of Sciences of the United States of America,
v. 108, p. 4035−4040, https://doi.org/10.1073/pnas.1100371108.
- Lüthi, D., Le Floch, M., Bereiter, B., Blunier, T., Barnola, J.-M., Siegenthaler, U., Raynaud, D.,
Jouzel, J., Fischer, H., Kawamura, K., and Stocker, T.F., 2008, High-resolution carbon dioxide
concentration record 650,000–800,000 years before present: Nature, v. 453, p. 379–382,
https://doi.org/10.1038/nature06949.
- Manos, P.S., Doyle, J.J., and Nixon, K.C., 1999, Phylogeny, biogeography, and processes of molecular
differentiation in Quercus subgenus Quercus (Fagaceae): Molecular Phylogenetics
and Evolution, v. 12, p. 333–349, https://doi.org/10.1006/mpev.1999.0614.
- McElwain, J.C., and Steinthorsdottir, M., 2017, Paleoecology, ploidy, paleoatmospheric composition,
and developmental biology: A review of the multiple uses of fossil stomata: Plant Physiology,
v. 174, p. 650–664, https://doi.org/10.1104/pp.17.00204.
- Mora, C., Dousset, B., Caldwell, I.R., Powell, F.E., Geronimo, R.C., Bielecki, C.R., Counsell,
C.W.W., Dietrich, B.S., Johnston, E.T., Louis, L.V., Lucas, M.P., McKenzie, M.M., Shea, A.G., Tseng,
H., Giambelluca, T.W., Leon, L.R., Hawkins, E., and Trauernicht, C., 2017, Global risk of deadly
heat: Nature Climate Change, v. 7, p. 501–506, https://doi.org/10.1038/nclimate3322.
- Morton, L.W., Hobbs, J., Arbuckle, J.G., and Loy, A., 2015, Upper Midwest climate variations: Farmer
responses to excess water risks: Journal of Environmental Quality, v. 44, p. 810–822,
https://doi.org/10.2134/jeq2014.08.0352.
- Mu, Q., Zhao, M., and Running, S.W., 2013, MODIS global terrestrial evapotranspiration (ET) product:
NASA document https://modis-land.gsfc.nasa.gov/pdf/MOD16ATBD.pdf (accessed 26 Aug. 2019).
- National Oceanographic and Atmospheric Administration, 2019a, Climatic data online for Hannibal
water works (USC00233601) and St Charles (USC00237397), Missouri: https://www.noaa.gov (accessed 4
Apr. 2019).
- National Oceanographic and Atmospheric Administration, 2019b, CO2 observed on Mauna Loa:
https://www.esrl.noaa.gov/gmd/ccgg/trends/ (accessed 5 Mar. 2019).
- Retallack, G.J., 2001, A 300-million-year record of atmospheric carbon dioxide from fossil plant
cuticles: Nature, v. 411, p. 287–290, https://doi.org/10.1038/35077041.
- Retallack, G.J., 2009, Greenhouse crises of the past 300 million years: Geological Society of
America Bulletin, v. 121, p. 1441–1455, https://doi.org/10.1130/B26341.1.
- Retallack, G.J., and Conde, G.D., 2020, Deep time perspective on rising atmospheric CO2:
Global and Planetary Change, v. 189, 103177, https://doi.org/10.1016/j.gloplacha.2020.103177.
- Royer, D.L., Berner, R.A., and Beerling, D.J., 2001, Phanerozoic atmospheric CO2 change:
Evaluating geochemical and paleobiological approaches: Earth-Science Reviews, v. 54,
p. 349–392, https://doi.org/10.1016/S0012-8252(00)00042-8.
- Sohl, T., Reker, R., Bouchard, M., Sayler, K., Dornbierer, K., Wika, S., Qunzer, R., and Friesz, A.,
2016, Modeled historical land use and land cover for the conterminous United States: Journal of Land
Use Science, v. 11, p. 476–499, https://doi.org/10.1080/1747423X.2016.1147619.
- Steinthorsdottir, M., Woodward, F.I., Surlyk, F., and McElwain, J.C., 2012, Deep-time evidence of a
link between elevated CO2 concentrations and perturbations in the hydrological cycle via
drop in plant transpiration: Geology, v. 40, p. 815–818, https://doi.org/10.1130/G33334.1.
- Sugano, S.S., Shimada, T., Imai, Y., Okawa, K., Tamai, A., Mori, M., and Hara-Nishimura, I., 2010,
Stomagen positively regulates stomatal density in Arabidopsis: Nature, v. 463,
p. 241–244, https://doi.org/10.1038/nature08682.
- U.S. Army Corps of Engineers, 2019, Mississippi River at Hannibal, Missouri,
http://rivergages.mvr.usace.army.mil (accessed 2 Apr. 2019).
- U.S. Department of Agriculture National Agricultural Statistics Service, 2019,
https://www.nass.usda.gov/Publications/Ag_Statistics/2017/Chapter09.pdf (accessed 4 Apr. 2019).
- Vogel, R.M., Yaindl, C., and Walter, M., 2011, Nonstationarity: Flood magnification and recurrence
reduction factors in the United States: Journal of the American Water Resources Association,
v. 47, p. 464–474, https://doi.org/10.1111/j.1752-1688.2011.00541.x.
- Wallace, J.M., Held, I.M., Thompson, D.W., Trenberth, K.E., and Walsh, J.E., 2014, Global warming
and winter weather: Science, v. 343, p. 729–730,
https://doi.org/10.1126/science.343.6172.729.
- Wolfram Alpha, 2019, Computational intelligence website: https://www.wolframalpha.com (accessed 21
Aug. 2019).
- Woodward, F.I., 1987, Stomatal numbers are sensitive to increases in CO2 from
pre-industrial levels: Nature, v. 327, p. 617–618, https://doi.org/10.1038/327617a0.
- Yan, X.H., Boyer, T., Trenberth, K., Karl, T.R., Xie, S.-P., Nieves, V., Tung, K.-K., and Roemmich,
D., 2016, The global warming hiatus: Slowdown or redistribution?: Earth’s Future, v. 4,
p. 472–482, https://doi.org/10.1002/2016EF000417.