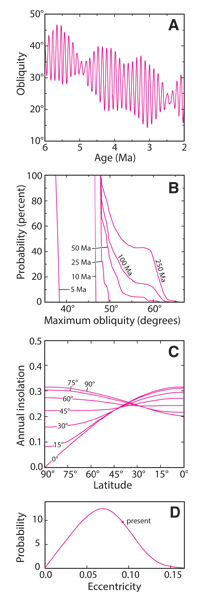
Figure 3.
(A) Obliquity of Mars at 2–6 Ma as calculated by Touma and Wisdom (1993). Note that obliquity exceeded 40° at 5–6 Ma. (B) Probability of reaching high obliquities during the chaotic obliquity evolution of Mars over a range of time periods, with initial 25° obliquity (from Laskar et al., 2004). (C) Total annual insolation versus latitude for obliquity variation of 0°–90°. Insolation units are relative to the solar constant at 1.52 AU (from Ward, 1974). (D) Normalized density function for chaotic eccentricity variation for Mars (from Figure 18d of Laskar et al., 2004). At present eccentricity, solar insolation at perihelion (orbital point closest to the Sun) is 45% greater than at aphelion.