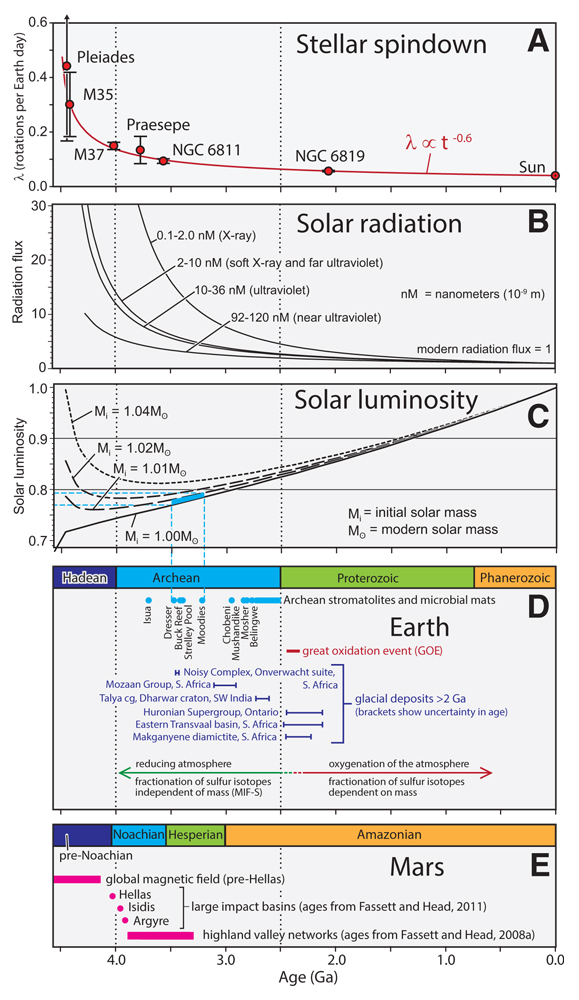
Figure 2.
Known or hypothetical evolution of the Sun, Earth, and Mars. (A) Star clusters, each containing stars of similar age, are plotted against rotation rate (Rebull et al., 2016, 2017; Meibom et al., 2009, 2011, 2015; Hartman et al., 2009). These are plotted as proxies for solar evolution, so cluster age on the horizontal axis is plotted as distance from the left edge of the graph rather than the right edge. Curve showing approximate spindown rate is from Ayres (1997; t = time since cluster birth). (B) Ultraviolet and X-ray radiation fluxes inferred for the Sun over time based on measured fluxes from nearby stars with approximate solar mass but different ages (modified from Figure 8 of Ribas et al., 2005). Current radiation flux = 1. (C) Evolution of solar luminosity for initial solar mass equal to, or slightly greater than, modern solar mass. The rate of mass loss is shown as proportional to the rate of spindown of solar type stars as shown in (A). Current luminosity = 1.0. Blue area at 3.2–3.5 Ga represents calculated luminosity (~77%–79% of modern) at the time of deposition of four stromatolite and microbial mat fossil units in northwest Australia and South Africa. (D) Some events in Earth history that reflect climate and atmospheric composition, including ages and names of Archean stromatolite and microbial mat deposits older than ca. 2.7 Ga and ages and names of glacial deposits older than ca. 2.0 Ga. Archean glacial deposits from Young et al. (1998; Mozaan), Ojakangas et al. (2014; Talya), and de Wit and Furnes (2016; Noisy) (cg—conglomerate). (E) Some events in Mars history. Pre-Noachian magnetization of the martian crust ended before formation of the Hellas impact basin. Noachian to early Hesperian highland valley networks formed after the large impact basins.