Figure 2.
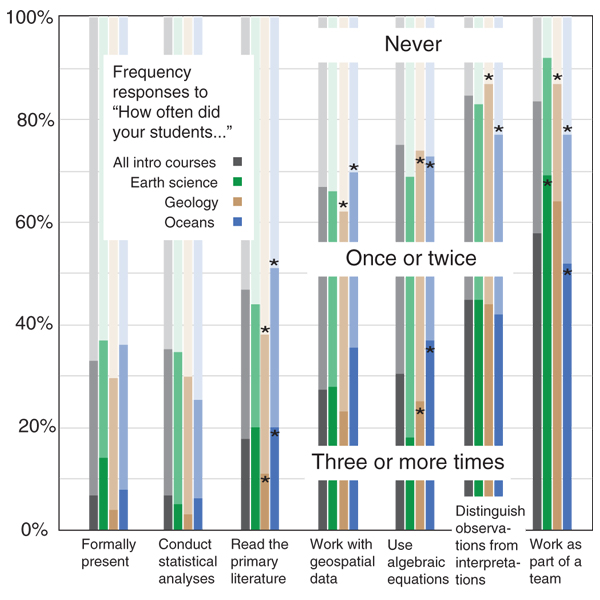
Histogram showing frequencies of use of practices for all introductory courses and for Earth science, geology, and oceans courses. Asterisks indicate statistically significant differences in proportions (p < 0.05) between discipline areas.
Histogram showing frequencies of use of practices for all introductory courses and for Earth science, geology, and oceans courses. Asterisks indicate statistically significant differences in proportions (p < 0.05) between discipline areas.