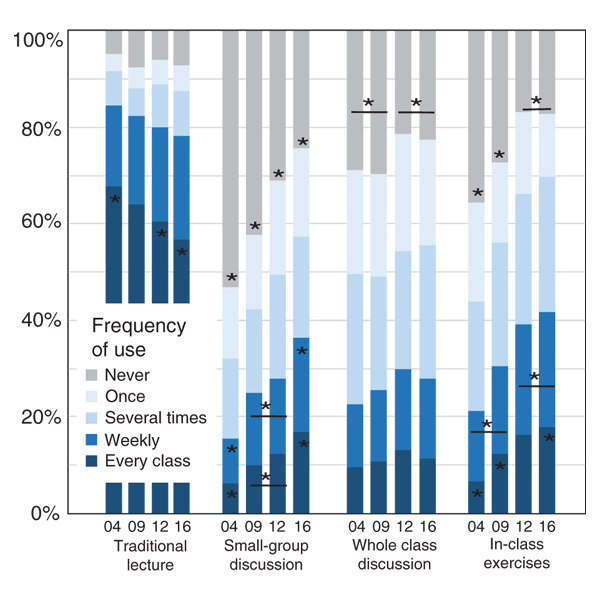
Figure 1.
Histogram showing the frequency of use of teaching strategies over the four survey administrations. Asterisks indicate statistically significant differences in proportions (p < 0.05) between survey years; the significance is only shown for a particular frequency of use when there is a difference between multiple years. Asterisks with bars indicate that there is no significant difference between the two years connected by the bars, but there is a difference between those two years and the others.