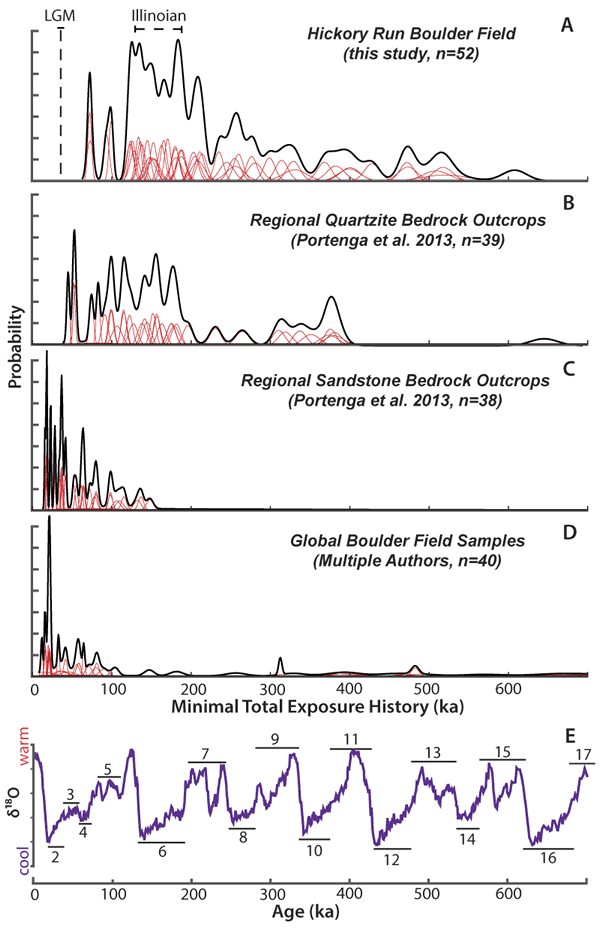
Figure 6.
Summed probability plots of minimum total near-surface history derived from 10Be. Red curves represent single 10Be measurements with 2σ internal error; the black line represents the sum of all samples. (A) All Hickory Run samples. (B) Quartzite bedrock outcrops. (C) Sandstone outcrops. (D) Other boulder field samples (Barrows et al., 2004; Goodfellow et al., 2014; Seong and Kim, 2003; Wilson et al., 2008). (E) Stable δ18O ratios in deep sea foraminifera (Railsback et al., 2015). Even numbers represent cold glacial stages; odd numbers are interglacials. LGM—Last Glacial Maximum.