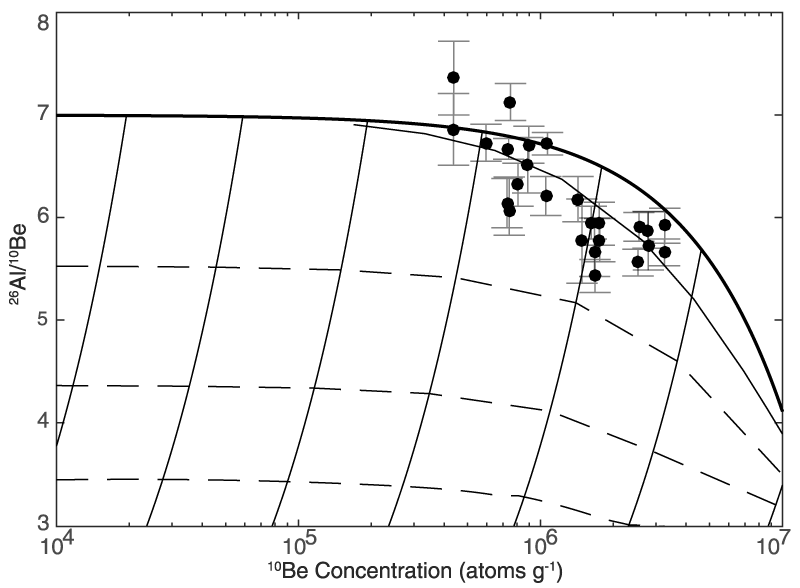
Figure 5.
Measured 26Al/10Be plotted against measured 10Be concentrations (n = 25). Plot is based on a local production rate of six atoms g−1 y−1 and surface production ratio of 7.0 (Argento et al., 2013). The thick black line indicates constant surface exposure, and the line beneath it marks the end of the “steady erosion envelope”; points beneath this envelope have had at least one period of burial or shielding during or after exposure. Thin lines represent the trajectory that a sample would follow if buried, and dotted lines indicate burial isochrons of 0.5, 1.0, and 1.5 m.y. assuming surface exposure followed by deep burial (top to bottom).