
Page 5 - i1052-5173-31-11
P. 5
less dense grains (Force, 1991). This depen-
dence on physical processes makes mining
and remediation relatively simple: mineral
separation is conducted using density, mag-
netic, or electrical methods, allowing waste,
which consists primarily of lighter sands Airborne Santee Dam
such as quartz, to be safely returned to mine 3°30ʹN Survey Area N
Lake
pits (Van Gosen et al., 2014). Marion
Several studies have shown that radiomet- 3
ric methods can directly image shallow Lake
Ti-Zr-REE–heavy mineral sand concentra- Moultrie
tions due to the natural radioactivity of mon-
azite, an REE-phosphate mineral containing
small amounts of Th and U (Mahdavi, 1964; 3°N
Robson and Sampath, 1977). Early airborne 3
surveys used scintillation to measure the
total gamma ray count (Force et al., 1982;
Grosz, 1983; Mudge and Teakle, 2003). In Sands
subsequent years, airborne gamma spec- Claysand mud
trometry methods were developed, allowing 32°30ʹN Charleston Alluvial sediment
the distinction of signals due to K, Th, and U A
(International Atomic Energy Agency, 2003;
Duval et al., 2005). In most of the United 80°30ʹW 8 0°W 7 9°30ʹW
States, gamma spectrometry surveys are
currently limited by coarse line spacing (1.6–
10 km) but do show broad regions in the N
southeastern U.S. where Ti-Zr-REE deposits
are prospective (Grosz et al., 1989; Shah et 33°30ʹN
al., 2017).
The 2019 South Carolina survey, flown
with modern equipment and 400-m flight
line spacing, represents the first high-reso-
lution public aeroradiometric survey over
U.S. Atlantic Coastal Plain sediments. 33°N
Coverage over 12,000 km with a footprint
2
of 100–200 m provides data at a scale not
1
feasible through drilling campaigns. The
survey allows new, basic questions regard-
ing the following to be addressed: (1) the
geologic and geomorphologic features asso- 32°30ʹN B
ciated with placer deposits; (2) the corre-
sponding geologic controls on formation;
and (3) the provenance, dominant delivery 80°30ʹW 8 0°W 7 9°30ʹW
pathways, and impacts on composition of Explana on (agesinkyr)
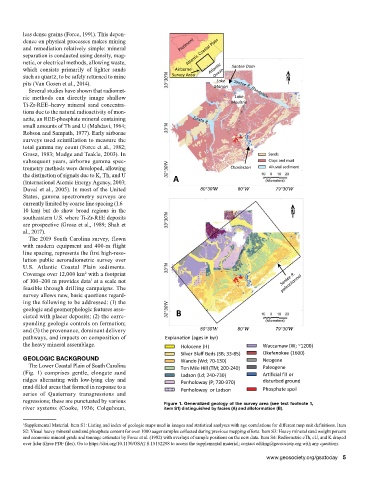
the heavy mineral assemblage. Holocene (H) Waccamaw(W; ~1200)
Silver Bluff Beds (SB; 33-85) Okefenokee (1600)
GEOLOGIC BACKGROUND Wando (Wd; 70-130) Neogene
The Lower Coastal Plain of South Carolina TenMile Hill (TM; 200-240) Paleogene
(Fig. 1) comprises gentle, elongate sand Ladson (Ld; 240-730) Ar ficial fillor
ridges alternating with low-lying clay and Penholoway(P; 730-970) disturbedground
mud-filled areas that formed in response to a PenholowayorLadson Phosphatespoil
series of Quaternary transgressions and
regressions; these are punctuated by various Figure 1. Generalized geology of the survey area (see text footnote 1,
river systems (Cooke, 1936; Colquhoun, item S1) distinguished by facies (A) and alloformation (B).
1 Supplemental Material. Item S1: Listing and index of geologic maps used in images and statistical analyses with age correlations for different map unit definitions. Item
S2: Visual heavy mineral sand and phosphate content for over 1000 auger samples collected during previous mapping efforts. Item S3: Heavy mineral sand weight percent
and economic mineral grade and tonnage estimates by Force et al. (1982) with overlays of sample positions on the new data. Item S4: Radiometric eTh, eU, and K draped
over lidar (three PDF files). Go to https://doi.org/10.1130/GSAT.S.15152298 to access the supplemental material; contact editing@geosociety.org with any questions.
www.geosociety.org/gsatoday 5