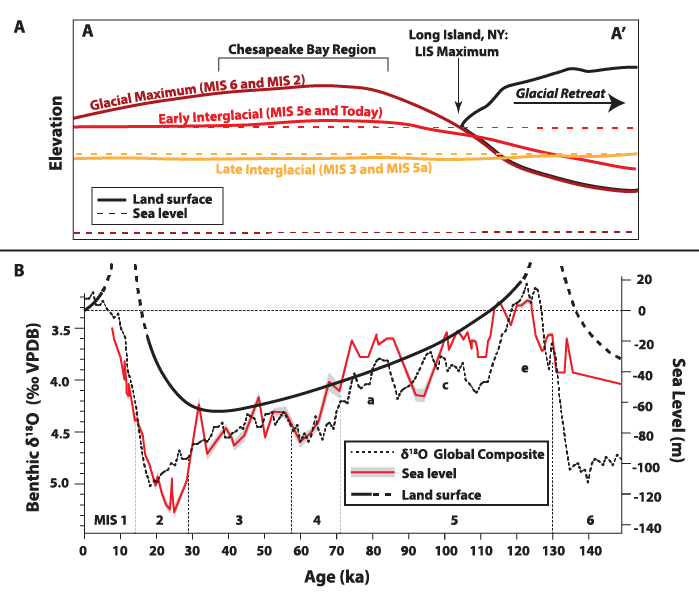
Figure 2.
(A) Schematic cross section showing relationship of land surface to relative sea level at specific times in glacial cycles as a function of distance from the Laurentide ice sheet (LIS). Adapted by permission from D. Krantz and C. Hobbs (2014, pers. comm.). Location of A–A´ cross section is indicated in Figure 1. (B) Oxygen isotope and sea-level curves for the past 150 k.y. from Lisiecki and Raymo (2005) and Thompson and Goldstein (2006), respectively. The glacioisostatic (land surface) curve (after Scott et al., 2010) is based on ages produced for shoreline deposits in the mid-Atlantic region and illustrates how land-surface elevation change induced by glacio-hydro-isostatic adjustment can account for submergence of the Chesapeake Bay region when eustatic sea level was much lower than present. VPDB—Vienna Pee Dee Belemnite.