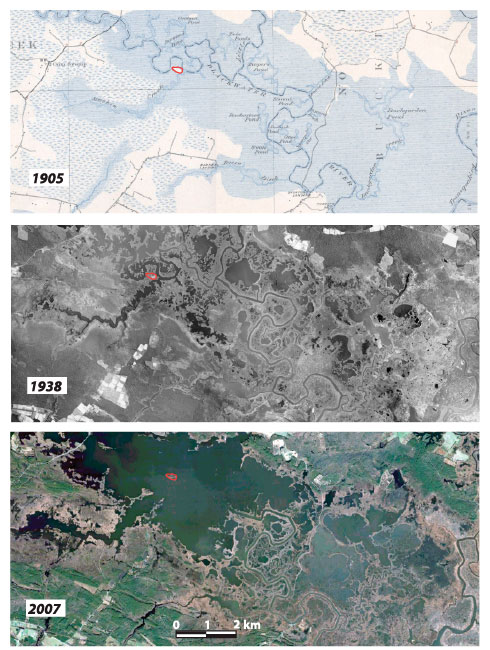
Figure 3.
Time series of the Blackwater River valley. Top: Intact marsh surveyed from AD 1902 to AD 1904 and presented in a 7.5˝ USGS topographic map from AD 1905 (USGS, 1905); dark blue hatching around the Blackwater valley is tidal marsh; light blue pattern is freshwater swamp. Middle: Initiation of major ponding seen in an aerial photograph from 1938 (http://www.esrgc.org/). Bottom: Coalesced ponds forming the informal “Lake Blackwater” in satellite imagery from AD 2007 (http://www.bing.com/maps/). Wetlands are converting to open water at a rate of 50–150 ha/yr in the field area (Cahoon et al., 2010). Image locations are identified in Figure 4B. Red outline shows location of unnamed island for reference.