Page 6 - gt1512
P. 6

A Photograph                  B Spectral cube with mineral                                                     C Representative spectra
                                                                                        indicators                                                                       c) Calcite
                                                                                                                                                                                                                                          1
                                                                                           Serpentine                                                                                       H2O                                           2
                                                                                           Tetr. Fe3+
                                                                                           Calcite                                                                                                     C-O

                                                                                          1
                                                                                                            eacRheflweacvtealnecnegtaht                                                                          Calcite +                3
                                                                                                                                       Reflectance (offset for clarity)                                          serpentine

                                                                                        4 Serpentine

                                                                                                                                                                         Fe2+                                                             4

                                                                                                                                                                                                           Serpentine
                                                                                        2 with tetr. Fe3+

                                                                                                                                                                         Tetrahedral                            OH Mg-OH           Tetr.
                                                                                                                                                                                                                                   Fe3+
                                                                                                                                                                         Fe3+

                                                    1 cm                                1 cm             3                                                               0.5 1.0 1.5 2.0 2.5 0.5
                                                                                                                                                                                         Wavelength (μm)

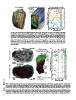
                                                    Figure 2. Hyperspectral image of a serpentinite sample with red and green coatings (Nor4-14, described in Greenberger et al., 2015b)
                                                    from Norbestos, Quebec, Canada. (A) Photograph of the full rock. (B) Image showing spectral parameters that map calcite (red),
                                                    serpentine (green), and a feature at 0.45 µm (BD450; blue) due to tetrahedral Fe3+ within serpentine. The third dimension shows the
                                                    reflectance as a function of wavelength for each pixel within the image, with black and purple being low and red high. (C) Plot with
                                                    representative spectra of different units within the hyperspectral image. Colors correspond to colors in the spectral parameter image
                                                    with locations numbered. Close-up views of the 0.45 µm feature are shown on the right. These images were acquired with Headwall
                                                    Photonics Inc. High Efficiency Hyperspec® visible–near-infrared E-series (0.4–1.0 µm, 7 nm spectral resolution, 0.382 mrad
                                                    instantaneous field of view) and High Efficiency Hyperspec® shortwave infrared X-series pushbroom systems (1.0–2.5 µm, 12 nm
                                                    spectral resolution, 1.2 mrad instantaneous field of view) imaging spectrometers (see GSA Supplemental Data Repository [see footnote 1] for
                                                    more information).

                                                    Interior             Amygdules      Thick section       C Thick section                                              D                                                     OH         Al- Fe/Mg-
                                                               Rind                                                                                                                                                                H2O OH OH
                                                                                                                                                                                                                 Datolite
                           A Near true color                                                                mineral indicator map                                                                                                           B-OH

                                                                                                                                 Datolite

                                                                                                            Calcite                                                                                              Fe2+/Fe3+
                                                                                                                                                                                                                  charge
                                                                                                                                Calcic clinopyroxene                                                              transfer                   Exterior
                                                                                                                             and Fe/Mg clay
                                                                                                                                                                         Reflectance (offset for clarity)        Fe2+

                           B Mineral indicator map  Transect
                                                    (far right)

                                                                  Calcic clinopyroxene
                                                                     and Fe/Mg-clay

                                                                                                                     Anhydrous
                                                                                                                       interior
                                                                                                                        matrix

                                                                                                                        3 mm

                                                                                                                                                                                                           Fe3+

                                                    Anydrous                                                Calcite                                                                                                                          Interior
                                                     interior
                                                      matrix                                       1 cm     SWIR slope typical of rind
                                                                                        Calcite
GSA TODAY | DECEMBER 2015                                                                                   Fe/Mg-clay                                                                                     0.5   1.0 1.5 2.0              2.5
                                                                                                                                                                                                                 Wavelength (μm)

                              Figure 3. (A) Color composite image from a hyperspectral image acquired with the same imaging system used in Figure 2, approximating the true color of a pillow
                              lava cross section. (B) Mineral indicator map showing calcite in red, a spectral slope indicative of the rind in green, and Fe/Mg-clay in blue. The cyan box shows
                              the approximate location of the material on the adjacent cut face from which a thick section was prepared and imaged. (C) Mineral indicator and spectral
                              parameter image of the thick section using the same parameters as (B). The dashed white outline shows the location of identified datolite. (D) Plot with spectral
                              transect from the interior through the alteration rind (purple to green; location of transect shown in A). The spectrum of the innermost point (purple) reflects
                              the oxidized, anhydrous nature of the interior matrix. Spectra of the rind (green) are consistent with an Fe/Mg-clay (chlorite and/or nontronite) and calcic
                              clinopyroxenes. Guidelines show absorption features due to various molecular vibrations or other key spectral characteristics. A scaled, three-point moving
                              average spectrum of datolite (black) acquired within the thick section is also shown. This figure is modified from data presented in Greenberger et al. (2015a).

                         6
   1   2   3   4   5   6   7   8   9   10   11