
Wind erosion in the Qaidam basin, central Asia: Implications for tectonics, paleoclimate, and the source of the Loess Plateau
Paul Kapp , Jon D. Pelletier, Alexander Rohrmann, Richard Heermance, Joellen Russell, Lin Ding
In this article
Full Text View
Volume 21 Issue 4/5 (April/May 2011)
GSA Today
Article, pp. 4-10 | Abstract | PDF (1MB)
Wind erosion in the Qaidam basin, central Asia: Implications for tectonics, paleoclimate, and the source of the Loess Plateau
[Table: Table of Contents Introduction History of Qaidam Wind Erosion Rates of Wind Erosion Implication...]
Paul Kapp1*, Jon D. Pelletier1**, Alexander Rohrmann1**, Richard Heermance2, Joellen Russell3, Lin Ding4
1 Dept. of Geosciences, University of Arizona, 1040 E 4th St., Tucson, Arizona, 85721, USA
2 Dept. of Geological Sciences, California State University, Northridge, California 91330-8266
3 Dept. of Geosciences, University of Arizona, 1040 E 4th St., Tucson, Arizona, 85721, USA
4 Institute of Tibetan Plateau Research, Chinese Academy of Sciences, Beijing 100085, People’s Republic of China
Abstract
Liquid water and ice are the dominant agents of erosion and sediment transport in most actively growing mountain belts. An exception is in the western Qaidam basin along the northeastern margin of the Tibetan Plateau, where wind and wind-blown sand have sculpted enormous yardang fields in actively folding sedimentary strata. Here, we present observations suggesting that since the late Pliocene, wind episodically (during glacial and stadial periods) removed strata from the western Qaidam basin at high rates (>0.12–1.1 mm/yr) and may have accelerated rates of tectonic folding. Severe wind erosion likely occurred during glacial and stadial periods when central Asia was drier and the main axis of the polar jet stream was located ~10° closer to the equator (over the Qaidam basin), as predicted by global climate models. Reconstructed wind patterns, the estimated volume of Qaidam basin material removed by wind, and numerical models of dust transport all support the hypothesis that the Qaidam basin was a major source of dust to the Loess Plateau.
*E-mail:
**Now at Institut für Geowissenschaften, Universität Potsdam, 14476 Potsdam, Germany
Manuscript received 13 Apr. 2010; accepted 20 Sept. 2010
DOI: 10.1130/GSATG99A.1
INTRODUCTION
The 700-km-long, up to 300-km-wide Qaidam basin (Figs. 1 and 2A) encompasses one of the highest (~2800 m elevation) and driest (<50 mm/yr precipitation in its western part) deserts on Earth, and it is actively shortening NE-SW in response to the ongoing collision between India and Asia (Tapponnier et al., 2001). A common inference, likely because of its low relief (<300 m), intermontane and internally drained setting, and thick accumulations of late Cenozoic sediment, is that the Qaidam basin is actively filling with sediment. However, roughly one-third of the modern Qaidam basin floor (~3.88 × 10⁴ km2) actually exposes folded sedimentary strata (Fig. 2A) exhumed since the Pliocene due to uplift and wind erosion. Severe wind erosion is demonstrated in the western Qaidam basin by the presence of extensive fields of mega-yardangs (Figs. 2A–2C and 3A) (Goudie, 2007), which are ridges (and parallel troughs/ pans) carved in cohesive material by strong, unidirectional winds and saltating particles carried by the wind, with spacing and relief on the order of hundreds of meters and tens of meters (locally up to ~50 m), respectively. In most places, wind-carved substrata consist of relatively friable, Plio-Quaternary lacustrine deposits.
Figure 1
Shaded relief map of central Asia. Light-blue arrows indicate prevailing low-level wind directions. Dark-blue, dashed lines indicate main axis of polar jet stream in modern winter climate (over Gobi Desert; position from An, 2000) and that predicted by global climate models during glacial/stadial episodes (over Qaidam basin ~10° closer to the equator; Toggweiler and Russell, 2008).
Figure 2
(A) Landsat 7 image of Qaidam basin region. Red lines indicate locations of cross sections for which values of erosion, averaged across length of line, were determined (values in white boxes; units in meters). (B) and (C) Google Earth images showing yardang fields that have developed in folded Pliocene-Quaternary sedimentary strata. Spacing between major yardangs is ~100 m. Width of view in 2B is ~50 km.
Figure 3
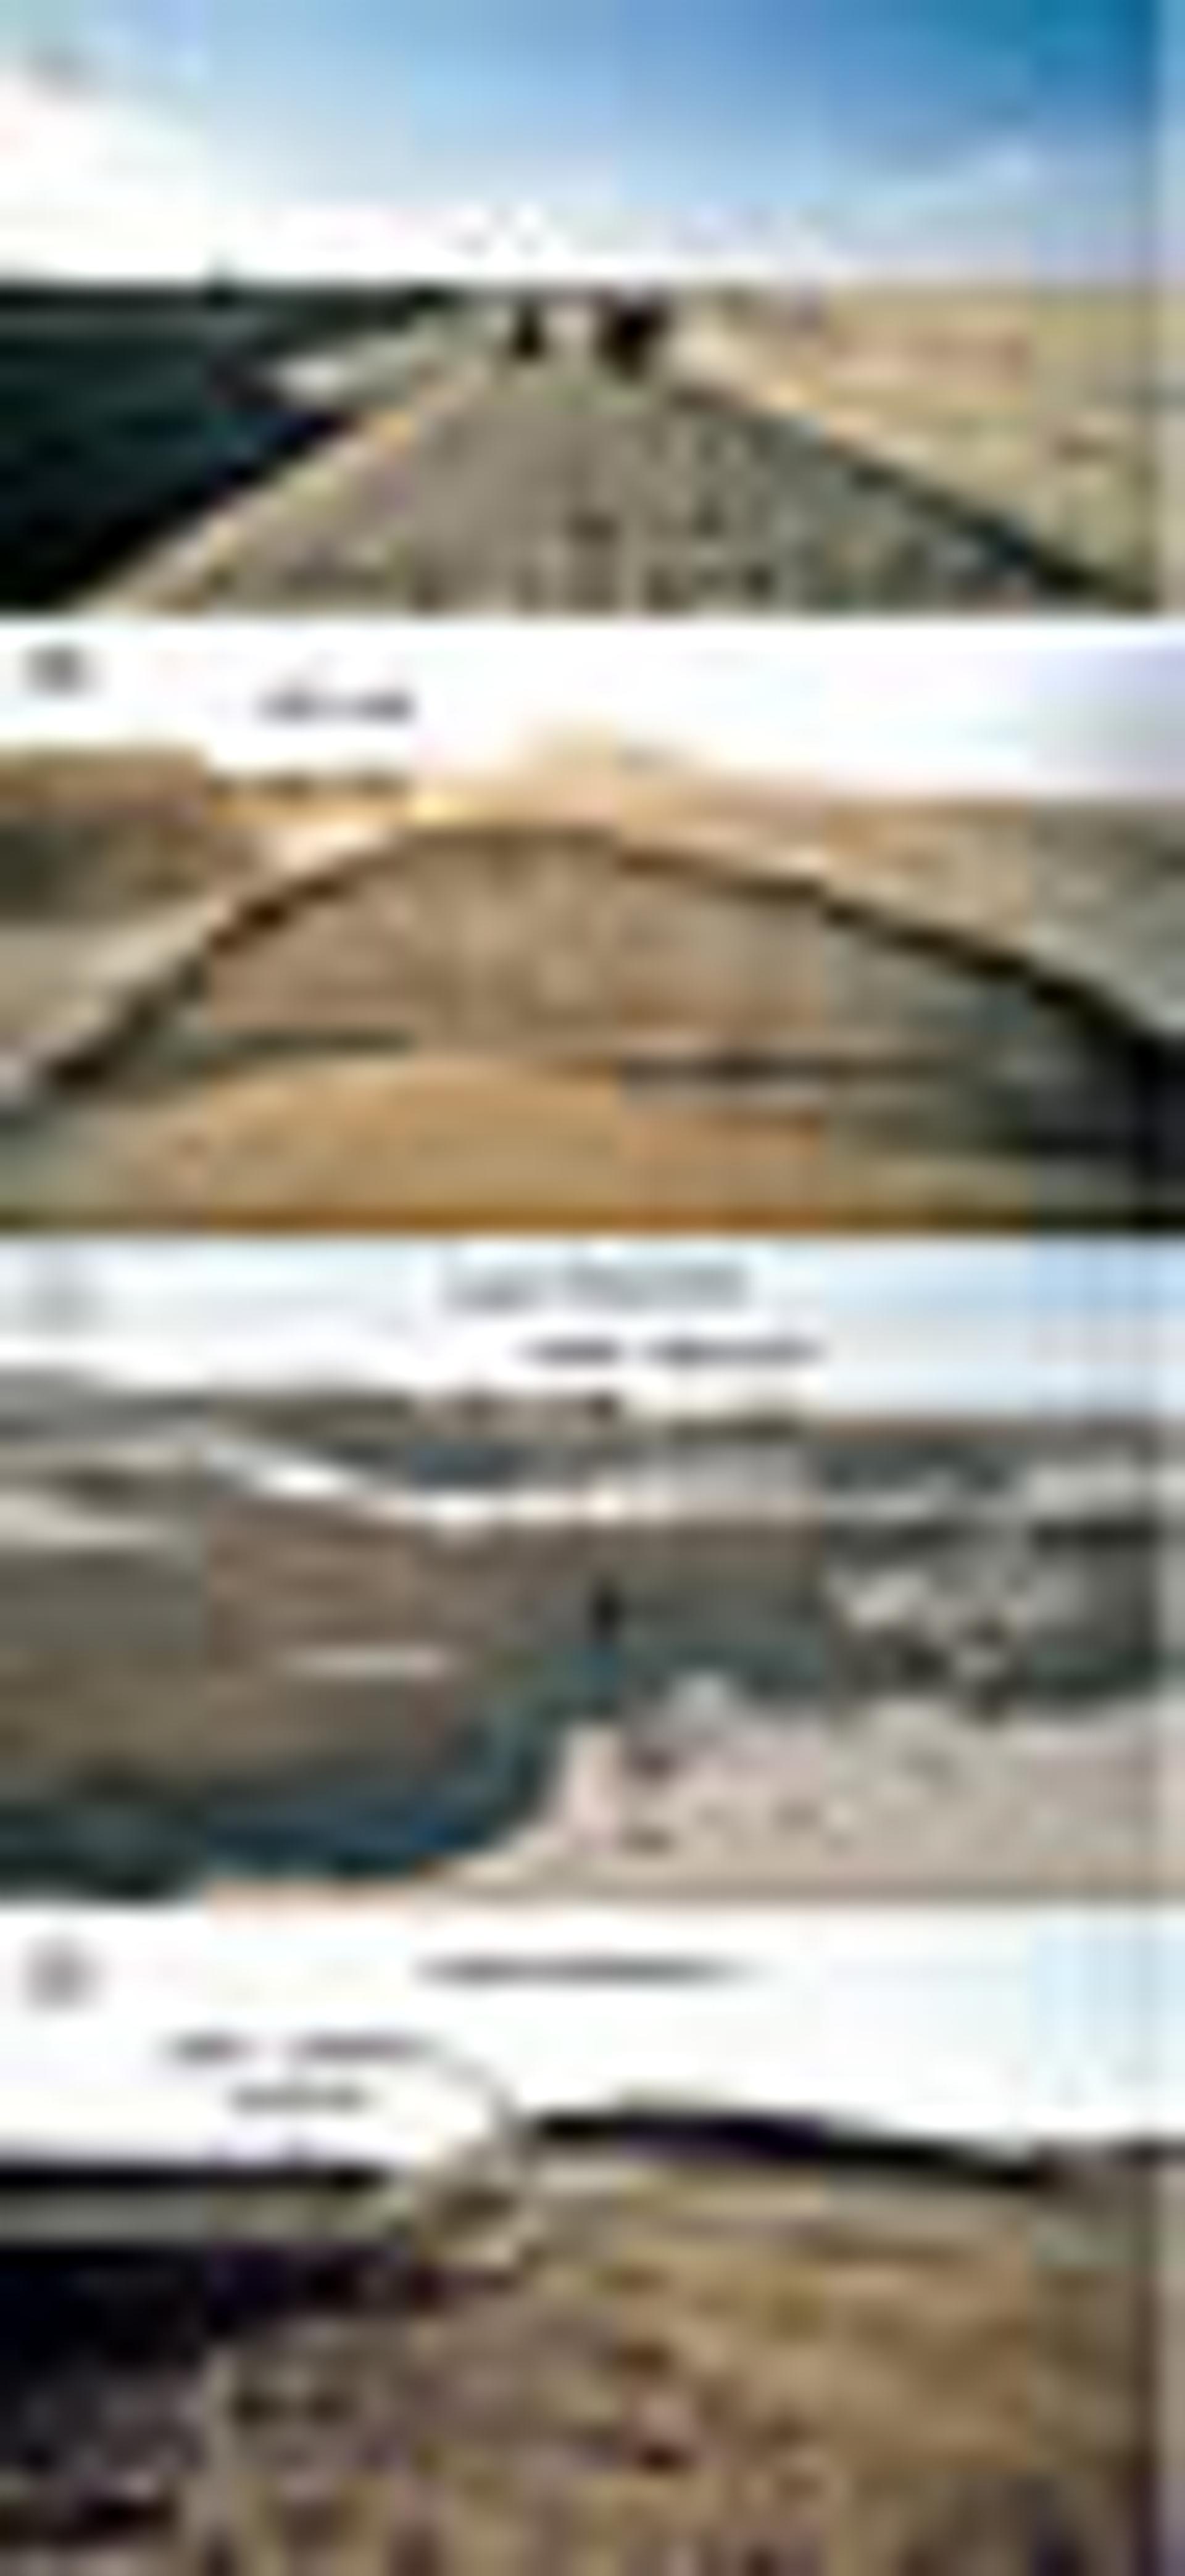
(A) Mega-yardangs sculpted in mainly lacustrine Pleistocene strata within the west-central Qaidam basin. (B) Roadcut exposure looking parallel to long axis of yardang. In many places, yardangs are armored in a resistant salt crust that is here ~35 cm thick. (C) Salt crust and (D) deflation lag deposits interbedded with lower Pleistocene lacustrine strata in the west- central Qaidam basin.
Yardang ridges form parallel to and taper in the direction of prevailing winds. The geometries of yardangs, and dune forms in ergs where present, reveal the prevailing wind pattern during their development (Fig. 2A). Northwesterly winds entered the Qaidam basin through topographic lows in the Altyn Tagh Range along its northwestern margin (Fig. 2A; Halimov and Fezer, 1989). Moving from west to east in the basin, the wind directions become more westerly, paralleling the trends of the >5000-m-high basin-bounding mountain ranges (Fig. 2A). Located downwind of the Qaidam basin is one of the most voluminous and best-exposed accumulations of Neogene-Quaternary loess on Earth—the Loess Plateau (e.g., Kukla, 1987; Porter, 2007) (Fig. 1). The alternating loess/paleosol stratigraphy of the Loess Plateau provides one of the richest terrestrial records of climate change since the Pliocene. Loess accumulation occurred primarily during glacial and stadial periods, when climatic conditions were drier in central Asia because of a weakened East Asian summer monsoon (e.g., An, 2000; Porter, 2007). Knowledge of the source regions for the loess, and how they have varied through time, is critical for assessing numerical models of atmospheric circulation during the Pliocene and Quaternary and the provenance of the nutrient-rich dust transported by high-level westerly winds into the Pacific Ocean, which may have increased marine productivity and contributed to the drawdown of atmospheric carbon dioxide during glacial periods (Rea, 1994; Bopp et al., 2003; Mahowald et al., 2006). In addition, Chinese loess input into the ocean has strongly altered seawater chemistry (e.g., Jacobson, 2004). Although it is widely argued that the bulk of Loess Plateau deposits was sourced from the Gobi and adjacent sand deserts (e.g., Sun, 2002; Sun et al., 2008), observations of spatially extensive fields of yardangs and the prevailing northwesterly to westerly wind pattern in the Qaidam basin suggest that its importance as a Loess Plateau source may presently be underappreciated.
History of Qaidam Wind Erosion
The wind erosion that produced the modern Qaidam yardangs must be younger than late Pleistocene because lacustrine strata of this age are widely exposed in the wind-eroded part of the basin (Pan et al., 2004). However, it does not appear that the Qaidam basin is presently undergoing severe wind erosion. No major dust-producing wind storms have been documented in the Qaidam during the past ~50 years (Sun et al., 2001). Also, the modern Qaidam yardangs are in many places armored with a decimeter-scale thick crust/paleosol of strongly indurated salt (Fig. 3B). This salt crust is not restricted to lower elevation areas of the basin where the salt could have been rapidly leached from the water table, but it is also in topographically higher areas, consistent with landform stability.
Based on the alternating wet and dry conditions characteristic of interglacial/interstadial and glacial/stadial periods, respectively, in central Asia during the Plio-Quaternary, it seems reasonable to speculate that the Qaidam basin experienced alternating episodes of sediment accumulation and wind erosion in phase with Loess Plateau paleosol development and loess accumulation. A supporting, preliminary investigation of Plio-Pleistocene basin fill in the west-central Qaidam basin shows that lacustrine sedimentation was punctuated by periodic episodes of subaerial exposure and wind erosion. The latter is evidenced by the presence of salt paleosols/crusts (Fig. 3C), deflation lag deposits (Fig. 3D), wind-storm deposits, paleopans filled with lacustrine and/or eolian deposits, and even paleoyardangs separating meter-scale parasequences of lacustrine strata (Heermance et al., 2009). Except for perhaps along the crests of large anticlines, which parallel topographic highs in the basin, sediment accumulation during periods of lacustrine deposition must have exceeded the thickness of material removed when wind erosion was active in order to lead to positive net sediment accumulation, the preservation of paleoyardangs, and the significant thicknesses of Plio-Quaternary fill exposed in the region. The ongoing folding in the Qaidam basin coupled with the most recent episode of severe wind erosion led to the preservation and exposure of this stratigraphic (and likely very rich paleoclimatic) record.
Rates of Wind Erosion
Quaternary wind-erosion rates have not been quantified in the Qaidam basin but must be significant. The modern Qaidam yardangs post-date occupation of large parts of the basin by lakes at sometime between 120 ka and 400 ka (Mischke et al., 2010). The development of yardangs with 50 m of relief requires minimum time-averaged erosion rates in the 0.12–0.42 mm/yr range in the troughs between yardangs, assuming an initial flat surface into which the yardangs were sculpted.
Time-averaged erosion rates can also be estimated over a longer time scale. Industry seismic-reflection profiles show that sediment accumulation was continuous across the entire Qaidam basin until ca. 2.8 Ma, when the appearances of growth strata indicate accelerated growth of folds within the western Qaidam basin (Zhou et al., 2006; Yin et al., 2008). The absence of angular unconformities imaged in ca. 2.8 Ma and older Neogene strata indicate that the erosion of Qaidam basin folds has occurred since 2.8 Ma. We use geological cross sections (Figs. 4 and DR11) to estimate how much strata have been removed from above Qaidam folds since 2.8 Ma (providing estimates of time-averaged erosion rates). Sedimentary deposits younger than 2.8 Ma in the western Qaidam basin are overwhelmingly evaporative lacustrine/playa, indicative of closed-basin conditions (Pan et al., 2004; Fang et al., 2008; Heermance et al., 2009). Hence, removal of sediment from the western Qaidam basin must have occurred by wind.
Figure 4
Geological cross sections constructed from unpublished 1:200,000-scale Chinese geological maps, showing minimum estimates of the amount of material removed from above Qaidam basin folds. Locations of lines are indicated on Figure 2. An effort was made to minimize the amount of material eroded, for instance, by thinning or pinching out units above the folds and not including material eroded from above some of the wind-eroded synclines where no bedding orientation data are available. In addition, we are unable to account for the possibly significant episodic wind erosion that could have contributed to thinning of the upper Pliocene and younger units.
1GSA supplemental data item 2011135, supplemental cross sections and notes on dust-transport modeling, is available online at www.geosociety.org/pubs/ft2011.htm. You can also request a copy from GSA Today, P.O. Box 9140, Boulder, CO 80301-9140, USA; .
Hundreds to thousands of meters of strata have been removed from above Qaidam basin folds since ca. 2.8 Ma based on geometric constraints provided by published regional cross sections (Zhou et al., 2006) (Fig. DR1 [see footnote 1]) and our own, more local cross sections constructed from unpublished 1:200,000-scale Chinese geological maps (Fig. 4). The numbers shown for individual cross-section lines (Fig. 2) indicate the line-averaged value of material eroded. These estimates are rough given uncertainties about how stratal thicknesses may vary across anticlines and the fold-growth histories. Encouraging, however, are the similar values obtained from the local and regional cross sections, and that the basin-wide average erosion value (average of all values weighted by length of cross section = 820 m) is identical to the value determined for the longest line across the central part of the wind-eroded basin (820 m; Fig. 2). This value, in turn, yields a basin-wide average erosion rate of 0.29 mm/yr over the past 2.8 Ma, within the range of the erosion-rate estimates determined using previous lake occupation as a reference datum (0.12–0.42 mm/yr). There are localized erosion hotspots above anticline crests where up to 3 km of strata have been removed (Figs. 4 and DR1 [see footnote 1]), corresponding to a time-averaged erosion rate of 1.1 mm/yr. These are minimum erosion rate estimates for when wind erosion was active because they are averaged over a time interval when erosion was not continuously active (excluding perhaps along the crests of the largest anticlines) but instead alternated with episodes of sediment accumulation.
Implications for Tectonic-Climate Interactions
Our estimates of wind-erosion rates in the sandblasted portion of the Qaidam basin are comparable to rates of fluvial and glacial erosion in tectonically active mountain ranges. The efficacy of wind in removing sediment from the Qaidam basin may be attributed to a combination of strong unidirectional winds, the nature of the material being eroded (mainly young, friable lacustrine deposits), and ongoing folding that brings a continuous supply of this material toward the surface. At least locally above crests of actively growing anticlines, the erosion rates are comparable to those in the Himalaya (~1 mm/yr in the Miocene and accelerating to 2–3 mm/yr during the past few million years; Vance et al., 2003; Rahl et al., 2007) and other orogens where it has been proposed that erosion has had a positive feedback relationship with rock deformation and rock uplift (e.g., Beaumont et al., 2001; Simpson, 2004; Whipple, 2009). The possibility of an analogous positive feedback relationship between focused erosion and rock deformation in the Qaidam basin, except in response to wind rather than fluvial or glacial processes, is intriguing.
An outstanding issue is the extent to which tectonics led to enhanced wind erosion in the Qaidam basin and vice versa. Tectonically driven acceleration of the northeastward growth of the Tibetan Plateau since the late Miocene (e.g., Molnar, 2005), with a possible pulse of mountain building along the northern and eastern margins of the Qaidam basin at 3.6–2.6 Ma (e.g., An et al., 2001), may have helped establish the hyperarid conditions conducive to wind erosion in the Qaidam basin. In the case of the Qaidam basin, however, the onset of severe wind erosion may have enhanced fold growth. A supporting observation is the unlikely coincidental, coeval (at 2.8–2.5 Ma) acceleration of loess accumulation on the Loess Plateau (An, 2000; Porter, 2007), suggesting enhanced wind erosion in its source region(s) at this time and initiation of rapid fold growth in the western Qaidam basin, as indicated by growth strata (Zhou et al., 2006). The onset of severe wind erosion corresponds in time with an increase in global ice volume and the onset of the glacial/interglacial cycles. While debate persists, a recent and popular explanation attributes this change in global climate to the establishment of the Indonesian Gateway rather than to mountain building or other climate drivers (e.g., Fedorov et al., 2006; Karas et al., 2009). Higher resolution data on the history of wind erosion and folding in the western Qaidam basin are needed to test the idea that climate change (wind erosion) may have locally accelerated tectonics.
An analysis of Qaidam fold geometries and their relationship to the prevailing wind directions reconstructed from modern yardang orientations (Fig. 5) raises the additional possibility that wind erosion may have influenced fold geometry and kinematics. The regional shortening direction along the northeastern margin of the Tibetan plateau is NE-SW (Tapponnier et al., 2001; Zhang et al., 2004). Hence, we would expect the axial traces of Qaidam folds to trend NW-SE. However, in many places, axial traces trend more E-W than expected and many folds are crescent-shaped in map view, with axial trace trends that vary from NW-SE to more E-W orientations. Many Qaidam anticlines are fault-propagation folds with steeper dipping forelimbs (indicated as dotted yellow lines on Fig. 5) and shallower dipping backlimbs. For every anticline shown on Figure 5, the forelimbs are located on the northern sides of the axial traces, indicating that the anticlines are propagating northward to northeastward, roughly in the up-wind direction. The latter observation may be fortuitous; the fold geometries may be controlled by reactivation or inversion of preexisting south- to southwest-dipping faults in the underlying basement. However, we raise another possibility that northerly to northwesterly winds caused more erosion on the northern forelimbs, where winds were forced to move up and over the anticlines, relative to the backlimbs. This enhancement of erosion along the northern forelimbs might have facilitated northward fault propagation, which in turn would create a topographically more abrupt forelimb that would further enhance and localize wind erosion. In essence, we suggest that the crescent-shaped geometries in map view and northward propagation direction of Qaidam folds may be a consequence of the superposition of the regional tectonic compressive stress in the NE-SW direction and stresses related to spatially non-uniform erosional unloading by wind.
Figure 5

Landsat 7 image of the northwestern Qaidam basin (location shown on Fig. 2A). White arrows—prevailing wind direction during yardang development; yellow lines—axial traces of fault-propagation anticlines; yellow dotted lines—steeper forelimbs of anticlines (perpendicular to propagation direction).
Implications for Paleoclimate and Source of Loess Plateau
The estimated volume of material removed from the Qaidam basin by wind is 3.2 × 10⁴ km3 (basin average erosion estimate of 820 m × modern yardang area of 3.88 × 10⁴ km2), equivalent to more than half of the total volume of Loess Plateau deposits (Porter, 2007; average thickness of 150 m × area = 6.0 × 10⁴ km3). The dominantly lacustrine strata removed from the Qaidam basin includes abundant silt and sand, and thus could be a source for the relatively coarse loess deposits of the Loess Plateau. The proportion of wind-eroded material that may have been redistributed to and stored within the eastern Qaidam basin is unknown. Nevertheless, this volume comparison combined with the northwesterly to westerly wind pattern in the Qaidam basin (Fig. 2) and the downwind position of the Loess Plateau warrant reconsideration of a source-sink relationship between the two (e.g., Bowler et al., 1987).
There are two major arguments challenging this proposition and that have strongly influenced current thinking. First, the bulk of central Asian dust entrained into the atmosphere by low-level wind storms during the past ~50 years of monitoring was sourced from the Gobi and adjacent sand deserts, as well as the Tarim basin (Taklimakan Desert) (Zhang et al., 2003a, 2003b; Sun et al., 2008) (Fig. 1). In the modern winter to spring climate, the main axis of the polar jet stream is located over the Gobi region (Fig. 1; An, 2000)—the locus of modern dust storms. During glacial and stadial periods, global climate models suggest that the main axes of the high-level westerlies in both the northern and southern hemispheres shift ≥10° in latitude toward the equator as a consequence of a decreased thermal contrast in the middle of the atmosphere (Yin, 2005; Williams and Bryan, 2006; Toggweiler and Russell, 2008). This places the main axis of the jet stream directly over the Qaidam basin (Fig. 1) during glacial and stadial periods, when we propose that wind erosion was most severe.
Second, the spatial variations in thickness (and grain size, which scales positively with thickness) of Loess Plateau deposits (Fig. 6A) (Zhang et al., 1999; Han et al., 2007) have been widely interpreted to support the hypothesis that modern conditions of loess transport by low-level northerly and northwesterly winds are applicable throughout the Pliocene-Quaternary. However, we show here using numerical models of dust transport that the spatial variations in thickness are consistent with westerly winds and a Qaidam basin source.
Figure 6
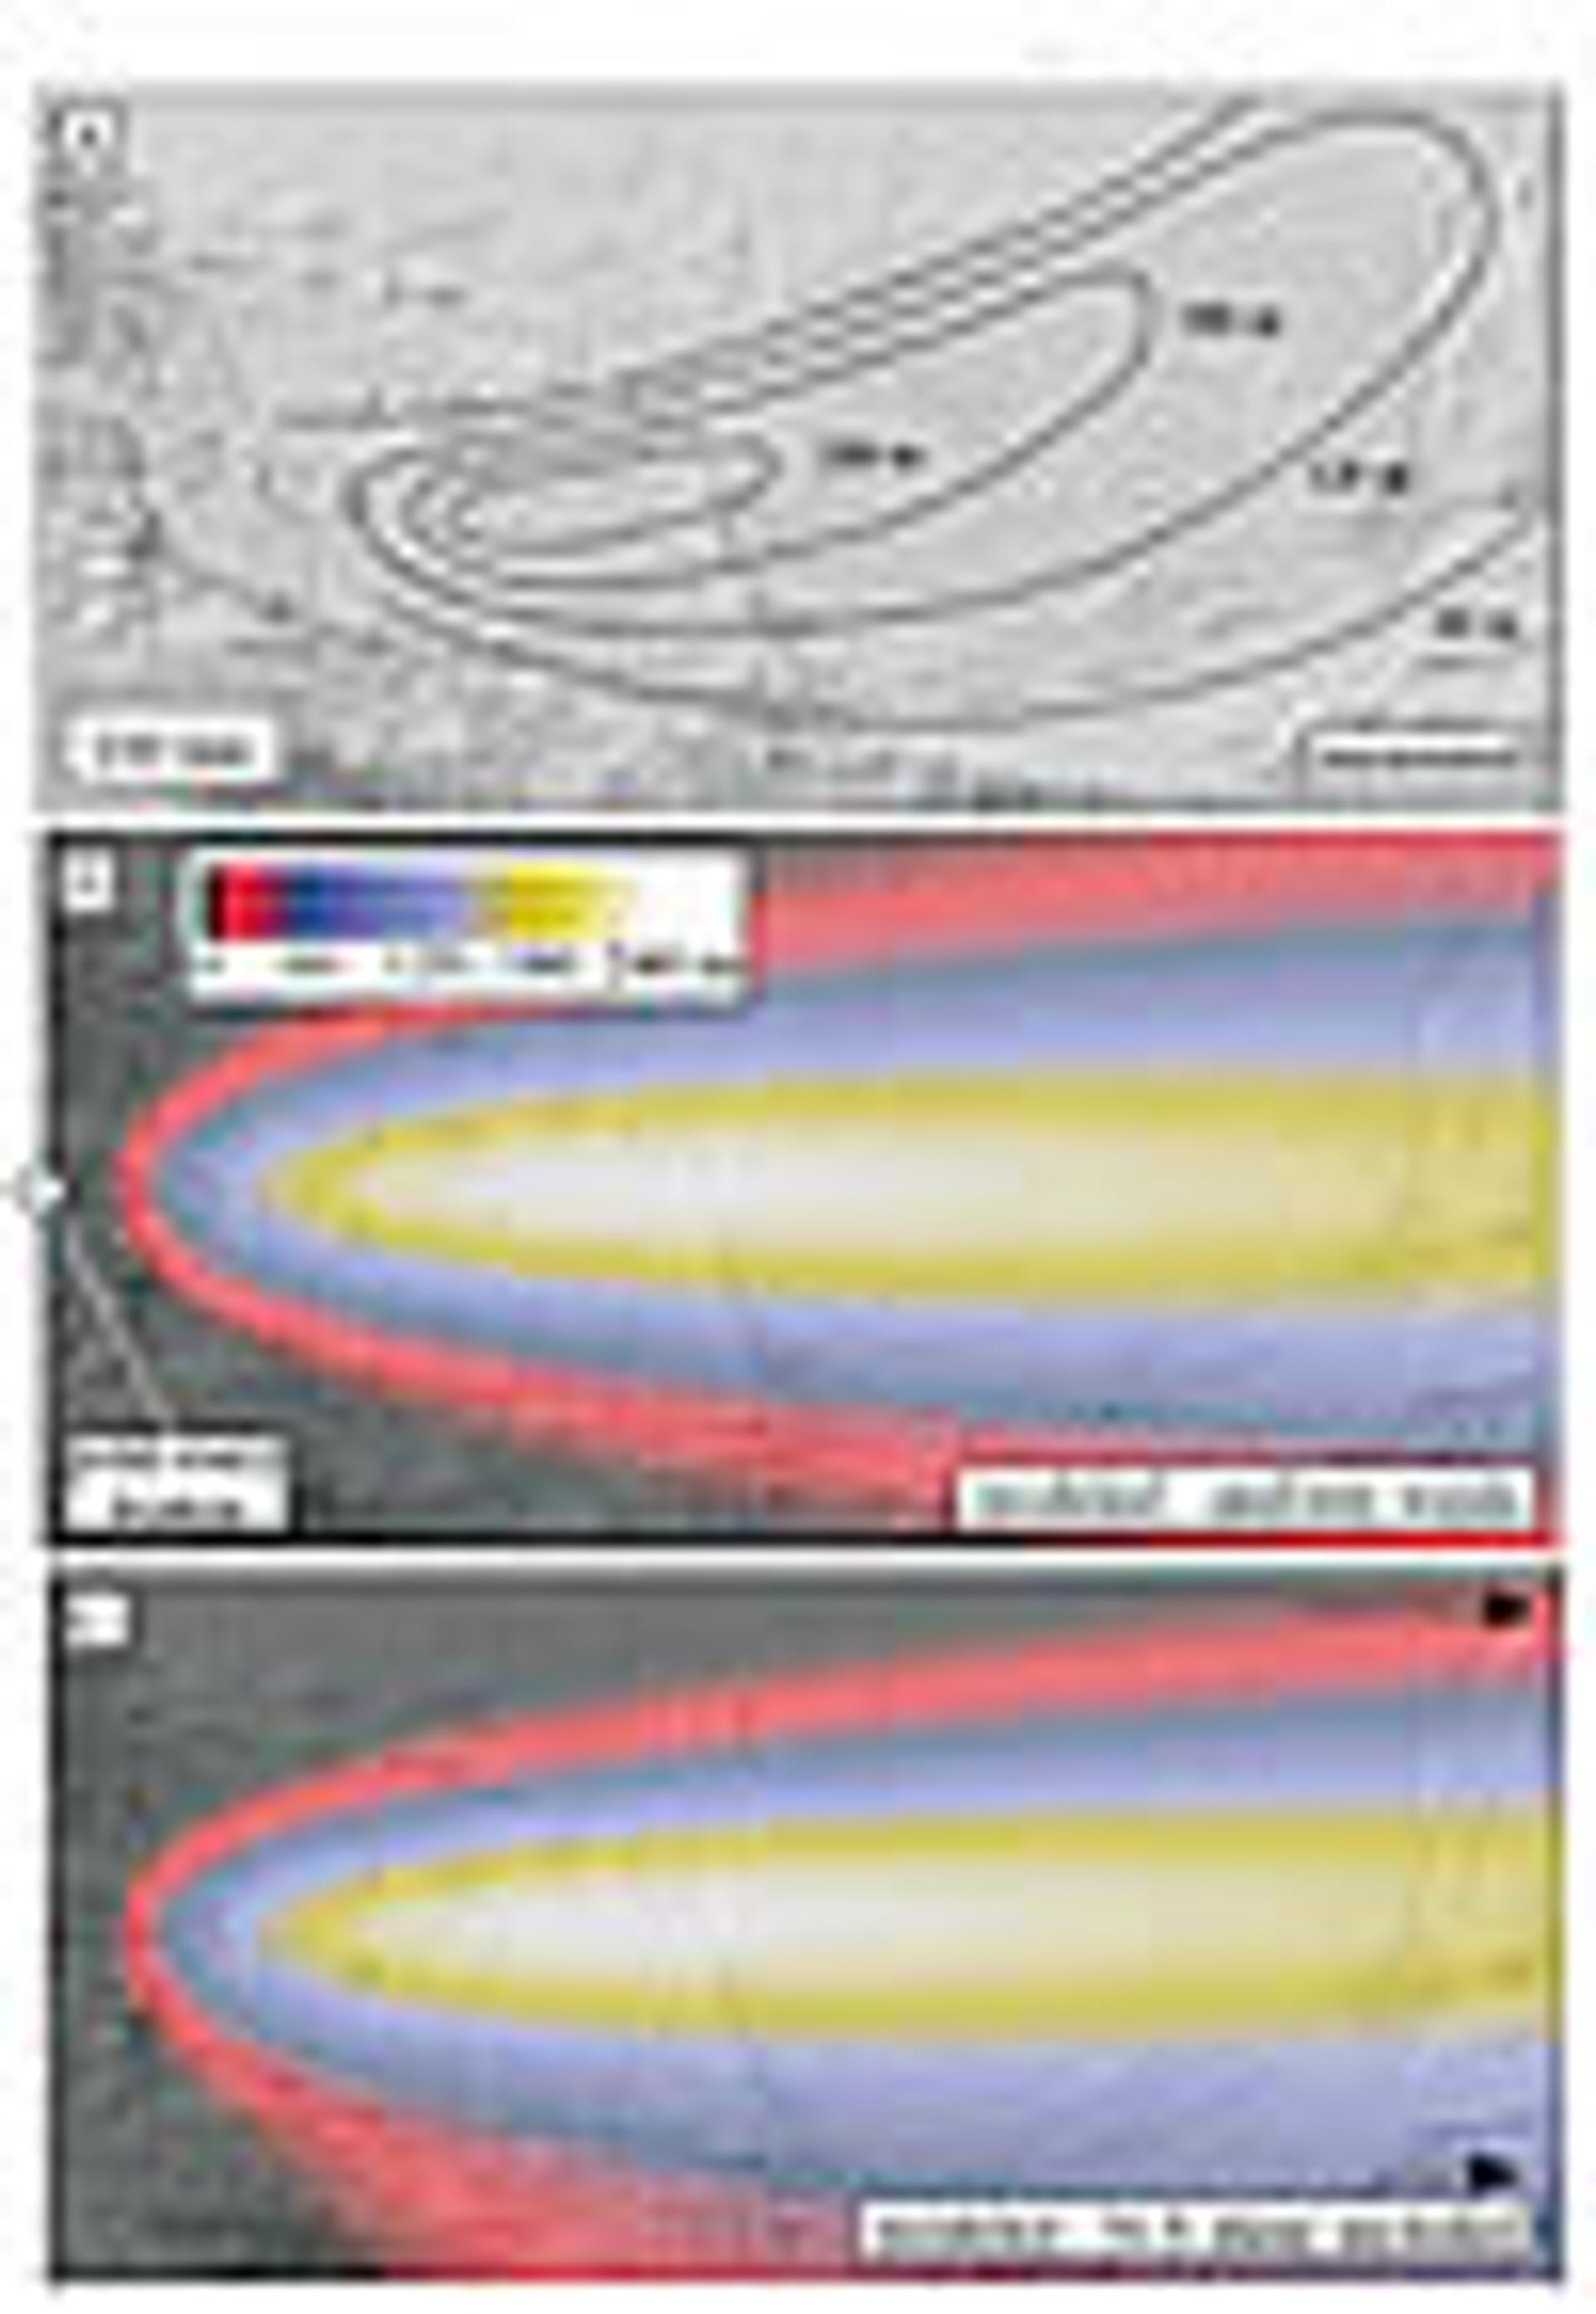
(A) Shaded relief topography of Loess Plateau with loess thickness contours superimposed (Nugteren and Vandenberghe, 2004). (B) Color map of predicted loess thickness for reference case solution. (C) Color map of predicted loess thickness with north-south wind velocity gradient included; otherwise, this model result corresponds to same parameters as in (B).
Atmospheric transport of particulate matter can be modeled as a combination of turbulent diffusion, downwind advection, and gravitational settling. Figures 6B and 6C illustrate deposition maps corresponding to steady-state advection-diffusion-settling models for dust emanating from an elevated (1500 m) point source located above the westernmost edge of the Loess Plateau. The source is elevated because the dust emanating out of the wind pass of the Qaidam basin is located 1500 m higher than the Loess Plateau. Additional model parameters include the mean wind velocity u (~10 m/s), the Rouse number ? (~0.3), and the turbulent diffusivity (which varies with elevation in the model, but at the source elevation of 1500 m above the substrate it has a value of ~100 m2/s; see supplemental data text [footnote 1] for model details).
Model results are shown in Figure 6B for the reference case of u = 10 m/s, ν = 0.3, and Kz(h) = Kx = 100 m2/s. The value of the source emission rate was scaled to match the observed maximum thickness of deposits in the Loess Plateau. The basis for this scaling is the similar order of the estimated volume of material eroded from the Qaidam basin and the volume of deposits in the Loess Plateau. For dust particles fine enough to be suspended in the atmosphere (i.e., ν significantly <1), the model results scale with the parameter h2u/Kz(h) (where h is the source elevation above the substrate), which has units of length. For the reference case (Fig. 6B), h2u/Kz(h) = 225 km. This value represents the distance between the point source location and the distance downwind from the source where the highest dust deposition rates are predicted. The observed pattern of loess thickness (Fig. 6A) corresponds quite closely with the predicted pattern. The sensitivity of dust deposition patterns corresponding to different values of u and Kz(h) can be determined by calculating h2u/Kz(h) and stretching or contracting the downwind deposition patterns linearly relative to the reference case value of 225 km. For a range of reasonable u and Kz(h) values (i.e., u = 5–15 m/s, Kz(h) = 50–150 m2/s), the downwind distance of the deposition “hotspot” varies within a range of 75 to 675 km.
Additional model details (including the justification and effects of the N-S wind velocity gradient included in Fig. 6C) are given in the supplemental data text (see footnote 1). Additional, second-order differences between model results and observed thickness may be explained by our hypothesis that dust is largely sourced from the Gobi region during interglacial and interstadial periods. However, since dust fluxes were 2–3 times greater during glacial episodes compared to interglacial episodes (Rea, 1994), in terms of volume percent, the Qaidam basin is likely the dominant source of loess to the Loess Plateau. Furthermore, our modeling work suggests that the turbulent dispersion of dust in the atmosphere promotes loess depozones that are larger in spatial extent than their source regions. As such, it is difficult to envision a scenario in which dust from the Gobi, Taklimakan, and other deserts of northern China and southern Mongolia (an area thousands of kilometers in extent) could have been concentrated into the much smaller area defined by the thickest (>100 m) deposits of the Loess Plateau.
Conclusions
The western Qaidam basin exposes enormous fields of yardangs sculpted by northwesterly to westerly winds in actively folding sedimentary strata. Emerging stratigraphic evidence suggests that the western Qaidam basin underwent alternating episodes of lacustrine deposition and wind erosion since the late Pliocene, which we hypothesize were in phase with episodes of paleosol formation and loess accumulation, respectively, in Loess Plateau deposits. Cross sections show that hundreds to thousands of meters of vertical strata have been removed from above Qaidam basin folds since 2.8 Ma, when the rate of fold growth accelerated. Given the prevalence of closed-basin conditions since at least the Pliocene, this material must have been transported out of the western Qaidam basin by wind. When active, wind erosion occurred at substantial rates (>0.12 mm/yr), particularly above anticline crests (>1 mm/ yr). The coeval acceleration at 2.8–2.5 Ma of Qaidam basin fold growth and wind erosion in central Asia, and the crescent- shaped map patterns and consistently up-wind propagation directions of Qaidam basin anticlines, raise the intriguing possibility that wind erosion enhanced and altered the kinematics of fold growth. We hypothesize that severe wind erosion in the Qaidam basin was mostly active during glacial and stadial periods when central Asia was drier and the main axes of the polar jet streams shifted toward the equator. The latter, in turn, shifted the source of Loess Plateau deposits from the Gobi and adjacent sand deserts (during interglacial conditions like those of the modern) to the Qaidam region.
Acknowledgments
We thank C. Chase, A. Cohen, J. Quade, J. Volkmer, and A. Yin for insightful discussions that helped refine our wind-erosion hypotheses. This manuscript also benefited from constructive suggestions and insightful comments by GSA Today science co-editor Stephen Johnston and reviewer An Zhisheng. Support for this research was provided by donors to the American Chemical Society Petroleum Research Fund (ACS PRF# 39376-G8) and a University of Arizona faculty small grant
REFERENCES CITED
- An, Z., 2000, The history and variability of the East Asian paleomonsoon climate: Quaternary Science Reviews, v. 19, p. 171–187.
- An, Z., Kuztbach, J.E., Prell, W.L., and Porter, S.C., 2001, Evolution of Asian monsoons and phased uplift of the Himalaya-Tibetan plateau since late Miocene time: Nature, v. 411, p. 62–66.
- Beaumont, C., Jamieson, R.A., Nguyen, M.H., and Lee, B., 2001, Himalayan tectonics explained by extrusion of a low-viscosity crustal channel coupled to focused surface denudation: Nature, v. 414, p. 738–742.
- Bopp, L., Kohfeld, K.E., Le Quere, C., and Aumont, O., 2003, Dust impact on marine biota and atmospheric CO2 during glacial periods: Paleoceanography, v. 18, p. 1046, doi: 10.1029/2002PA000810.
- Bowler, J.M., Chen, K., and Yuan, B., 1987, Systematic variations in loess source areas: Evidence from Qaidam and Qinghai basins, western China, in Tungsheng, L., ed., Aspects of Loess Research: Beijing, China Ocean Press, p. 39–51.
- Fang, X., Wu, F., Han, W.-B., Wang, Y., Zhang, X., and Zhang, W., 2008, Plio-Pleistocene drying process of Asian inland-sporopollen and salinity records from Yahu section in the central Qaidam basin: Quaternary Sciences, v. 28, p. 874–882 (in Chinese).
- Fedorov, A.V., Dekens, P.S., McCarthy, M., Ravelo, A.C., de Menocal, P.B., Barreiro, M., Pacanowski, R.C., and Philander, S.G., 2006, The Pliocene paradox (mechanisms for a permanent El Niño): Science, v. 312, p. 1485–1489, doi: 10.1126/science.1122666.
- Goudie, A.S., 2007, Mega-yardangs: A global analysis: Geography Compass, v. 1, p. 65–81, doi: 10.1111/j.1749-8198.2006.00003.x.
- Halimov, M., and Fezer, F., 1989, Eight yardang types in Central Asia: Zeitschrift für Geomorphologie, v. 33, p. 205–217.
- Han, J., Chen, H., Fyfe, W.S., Guo, Z., Wang, D., and Liu, T.S., 2007, Spatial and temporal patterns of grain size and chemical weathering of the Chinese Red Clay Formation and implications for East Asian monsoon evolution: Geochimica et Cosmochimica Acta, v. 71, p. 3990–4004, doi: 10.1016/j.gca.2007.05.027.
- Heermance, R.V., Kapp, P., Rohrmann, A., and McCallister, A., 2009, Extreme winds during the Quaternary deduced from yardang preservation within lacustrine sediments in the Qaidam Basin, China: Eos (Transactions, American Geophysical Union), v. 90, no. 52, Fall Meeting Supplement, Abstract PP21B-1341.
- Jacobson, A.D., 2004, Has the atmospheric supply of dissolved calcite dust to seawater influenced the evolution of marine 87Sr/86Sr ratios of the past 2.5 million years?: Geochemistry Geophysics Geosystems, v. 5, Q12002, doi: 10.1029/2004GC000750.
- Karas, C., Nürnberg, D., Gupta, A.K., Tiedemann, R., Mohan, K., and Bickert, T., 2009, Mio-Pliocene climate change amplified by a switch in Indonesian subsurface throughflow: Nature Geoscience, v. 2, p. 434–438, doi: 10.1038/ngeo520.
- Kukla, G., 1987, Loess stratigraphy in central China: Quaternary Science Reviews, v. 6, p. 191–219.
- Mahowald, N.M., Muhs, D.R., Levis, S., Rasch, P.J., Yoshioka, M., Zender, C.S., and Luo, C., 2006, Change in atmospheric mineral aerosols in response to climate: Last glacial period, preindustrial, modern, and doubled carbon dioxide climates: Journal of Geophysical Research, v. 111, D10202, doi: 10.1029/2005JD006653.
- Mischke, S., Sun, Z., Herzschuh, U., Qiao, Z., and Sun, N., 2010, An ostracod-inferred large middle Pleistocene freshwater lake in the presently hyper-arid Qaidam Basin (NW China): Quaternary International, v. 218, p. 74–85, doi: 10.1016/j.quaint.2009.03.002.
- Molnar, P., 2005, Mio-Pliocene growth of the Tibetan plateau and evolution of East Asian climate: Palaeontologia Electronica, v. 8, PE Article Number 8.1.2.
- Nugteren, G., and Vandenberghe, J., 2004, Spatial climatic variability on the Central Loess Plateau as recorded by grain size for the last 250 kyr: Global and Planetary China, v. 41, p. 185–206, doi: 10.1016/j.gloplacha.2004.01.005.
- Pan, G., Ding, J., Yao, D., and Wang, L., 2004, Geological map of the Qinghai-Xizang (Tibet) Plateau and adjacent areas, with guidebook: Chengdu, Chengdu Cartographic Publishing House, 48 p.
- Porter, S.C., 2007, Loess Records—China, in Scott, A.E., ed., Encyclopedia of Quaternary Science: Oxford, Elsevier, p. 1429–1440, doi: 10.1016/B0-44-452747-8/00160-5.
- Rahl, J.M., Ehlers, T.A., and van der Pluijm, B.A., 2007, Quantifying transient erosion of orogens with detrital thermochronology from syntectonic basin deposits: Earth and Planetary Science Letters, v. 256, p. 147–161, doi: 10.1016/j.epsl.2007.01.020.
- Rea, D.K., 1994, The paleoclimatic record provided by eolian deposition in the deep sea: The geologic history of wind: Reviews of Geophysics, v. 32, p. 159–195.
- Simpson, G., 2004, Role of river incision in enhancing deformation: Geology, v. 32, p. 341–344, doi: 10.1130/G20190.1.
- Sun, J., 2002, Provenance of loess material and formation of loess deposits on the Chinese Loess Plateau: Earth and Planetary Science Letters, v. 203, p. 845–859.
- Sun, J., Zhang, M., and Liu, T., 2001, Spatial and temporal characteristics of dust storms in China and its surrounding regions, 1960–1999: Relations to source area and climate: Journal of Geophysical Research, v. 106, p. 10,325–10,333.
- Sun, Y., Tada, R., Chen, J., Liu, Q., Toyoda, S., Tani, A., Ji, J., and Isozaki, Y., 2008, Tracing the provenance of fine-grained dust deposited on the central Chinese Loess Plateau: Geophysical Research Letters, v. 35, L01804, doi: 10.1029/2007GL031672.
- Tapponnier, P., Xu, Z., Roger, F., Meyer, B., Arnaud, N., Wittlinger, G., and Yang, J., 2001, Oblique stepwise rise and growth of the Tibet Plateau: Science, v. 294, p. 1671–1677.
- Toggweiler, J.R., and Russell, J., 2008, Ocean circulation in a warming climate: Nature, v. 451, p. 286–288, doi: 10.1038/nature06590.
- Vance, D., Bickle, M., Ivy-Ochs, S., and Kubik, P.W., 2003, Erosion and exhumation in the Himalaya from cosmogenic isotope inventories of river sediments: Earth and Planetary Science Letters, v. 206, p. 273–288, doi: 10.1016/S0012-821X(02)01102-0.
- Whipple, K.X., 2009, The influence of climate on the tectonic evolution of mountain belts: Nature Geoscience, v 2, p. 97–104, doi: 10.1038/NGEO413.
- Williams, G.P., and Bryan, K., 2006, Ice Age winds: An aquaplanet model: Journal of Climate, v. 19, p. 1706–1715.
- Yin, A., Dang, Y.-W., Zhang, M., Chen, X.-H., and McRivette, M.W., 2008, Cenozoic tectonic evolution of the Qaidam basin and its surrounding regions (Part 3): Structural geology, sedimentation, and regional tectonic reconstruction: GSA Bulletin, v. 120, p. 847–876, doi: 10.1130/B26232.1.
- Yin, J.H., 2005, A consistent poleward shift of the storm tracks in simulations of 21st century climate: Geophysical Research Letters, v. 32, L18701, doi: 10.1029/2005GL023684.
- Zhang, P.-Z., Shen, Z., Wang, M., Gan, W., Burgmann, R., Molnar, P., Wang, Q., Niu, Z., Sun, J., Wu, J., Hanrong, S., and Xinzhao, Y., 2004, Continuous deformation of the Tibetan Plateau from global positioning system data: Geology, v. 32, p. 809–812, doi: 10.1130/G20554.1.
- Zhang, X.Y., Arimoto, R., and An, Z.S., 1999, Glacial and interglacial patterns for Asian dust transport: Quaternary Science Review, v. 18, p. 811–819.
- Zhang, X.Y., Gong, S.L., Shen, Z.X., Mei, F.M., Xi, X.X., Liu, L.C., Zhou, Z.J., Wang, D., Wang, Y.Q., and Cheng, Y., 2003a, Characterization of soil dust aerosol in China and its transport and distribution during 2001 ACE-Asia: 1. Network observations: Journal of Geophysical Research, v. 108, 4261, doi: 10.1029/2002JD002632.
- Zhang, X.Y., Gong, S.L., Zhao, T.L., Arimoto, R., Wang, Y.Q., and Zhou, Z.J., 2003b, Sources of Asian dust and role of climate change versus desertification in Asian dust emission: Geophysical Research Letters, v. 30, 2272, doi: 10.1029/2003GL018206.
- Zhou, J., Xu, F., Wang, T., Cao, A., and Yin, C., 2006, Cenozoic deformation history of the Qaidam Basin, NW China: Results from crosssection restoration and implications for Qinghai-Tibet Plateau tectonics: Earth and Planetary Science Letters, v. 243, p. 195–210, doi: 10.1016/j.epsl.2005.11.033.
