
In this article
Authors
Michael Taylor*
Dept. of Geology, University of Kansas, Lawrence, Kansas 66045, USA
Adam Forte
Dept. of Geology and Geophysics, Louisiana State University, Baton Rouge, Louisiana 70803, USA
Andrew Laskowski
Dept. of Earth Sciences, Montana State University, Bozeman, Montana 59717, USA
Lin Ding
Institute of Tibetan Plateau Research, Chinese Academy of Sciences, Beijing, China
Abstract
North of the Himalayas is the Tibetan plateau—the largest physiographic feature on Earth related to intercontinental collision. Here, we study the rugged Gangdese Range along the southern drainage divide of the Tibetan plateau using a synthesis of geologic, thermochronologic, and interseismic geodetic observations that reveal that southern Tibet’s Gangdese Range is undergoing active surface uplift at present-day rates rivaling the Himalaya. Uplift has likely been sustained since the early Miocene, and we hypothesize that surface uplift of the Gangdese Mountains led to the development of Tibet’s internally drained plateau, as well as potentially reversed the course of the paleo Yarlung River, in tandem with exhumation of the Himalayan gneiss domes. We suggest the data are consistent with active thrust duplexing, balanced by upper crustal extension, effectively extending the active décollement between the underthrusting Indian plate and the Eurasian upper plate more than 200 km north of the High Himalayas.
* Corresponding author: mht@ku.edu
Manuscript received 3 Dec. 2020. Revised manuscript received 15 May 2021. Manuscript accepted 15 May 2021. Posted 21 June 2021.
© The Geological Society of America, 2021. CC-BY-NC.
https://doi.org/10.1130/GSATG487A.1
Introduction
The Himalayan-Tibetan orogen hosts the tallest and largest area of high topography, and thickest crust, on Earth, representing a dramatic expression of crustal shortening (Fielding et al., 1994) (Figs. 1–4). A topographic swath profile between longitudes 85–90°E (Figs. 1–4) illustrates from south to north the flat Indo-Gangetic plain, the foothills of the sub-Himalaya, the extreme relief of the High Himalayas, the broad east-west topographic trough of the Yarlung River valley, and the high crest of the Gangdese Range with its gentle north-facing slope. Regionally, geomorphic features north of the Yarlung River are superimposed upon the internally drained portion of the Tibetan plateau, which by area is the plateau’s largest surficial feature, forming a long wavelength depression encompassing ~600,000 km2 (Fielding et al., 1994) (Fig. 4). Given such vastness, the question of how the internally drained Tibetan plateau formed is a matter of pressing interest, although research to-date has been unable to determine a conclusive cause (Sobel et al., 2003; Horton et al., 2002; Kapp and DeCelles, 2019). In the following, we present preliminary results of ongoing work along the southern drainage divide of the Tibetan plateau, which coincides with the Gangdese Range. Compilations of low-temperature thermochronology, global positioning system (GPS), and terrain analysis reveal that the Gangdese Range has experienced recent surface uplift and is likely active today. This critical new observation sheds light on the style of active shortening across the India-Asia collision zone, with implications for large-scale drainage reorganizations for the Himalayas and Tibetan plateau. We begin with the neotectonic setting for the Himalayan-Tibetan orogen, followed by a discussion of potentially active structures, which suggest the Gangdese as a potential candidate to explain recent fluvial reorganizations across southern Tibet.
Figure 1
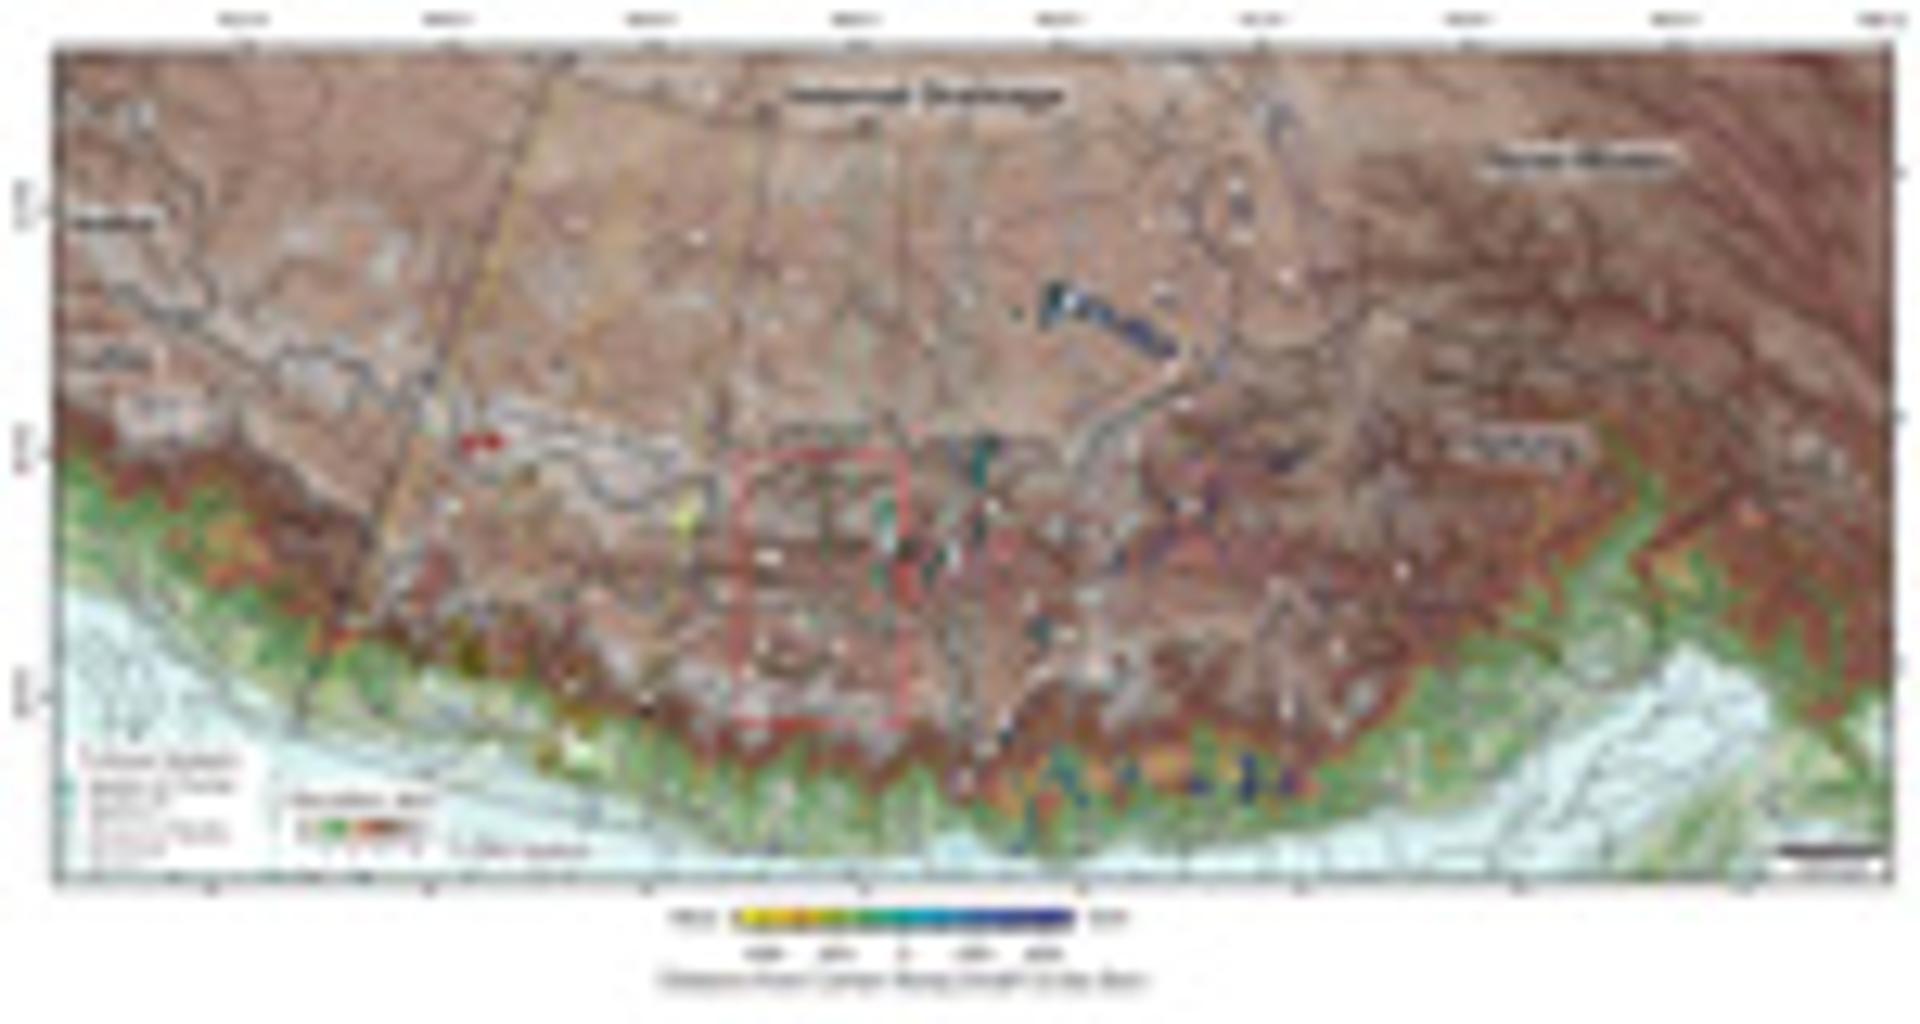
Shuttle Radar Topography Mission 90-m color shaded elevation map. Thermochronology data (Laskowski et al., 2018; Thiede and Ehlers, 2013) in Figure 4 are shown with thermochronometer type. Color scale bar indicates east-west position from swath profile in Figure 4. Open symbols—location in the hanging wall of a normal fault; white circles—GPS stations from Liang et al. (2013); dashed outlines—areas sampled for Figure 4; solid lines mark topography and precipitation in Figure 4A. Thick dotted lines mark centerline for distance measured along small circles in Figure 4A. Individual colored swaths sample dominant rivers in Figure 4B. Thick black lines are rivers and catchment areas for Sutlej, Indus, Yarlung, and Three Rivers, and zone of Internal Drainage. Red box shows location of Figure 2. Red symbol shows location of Figure S1 [see text footnote 1].
Figure 2
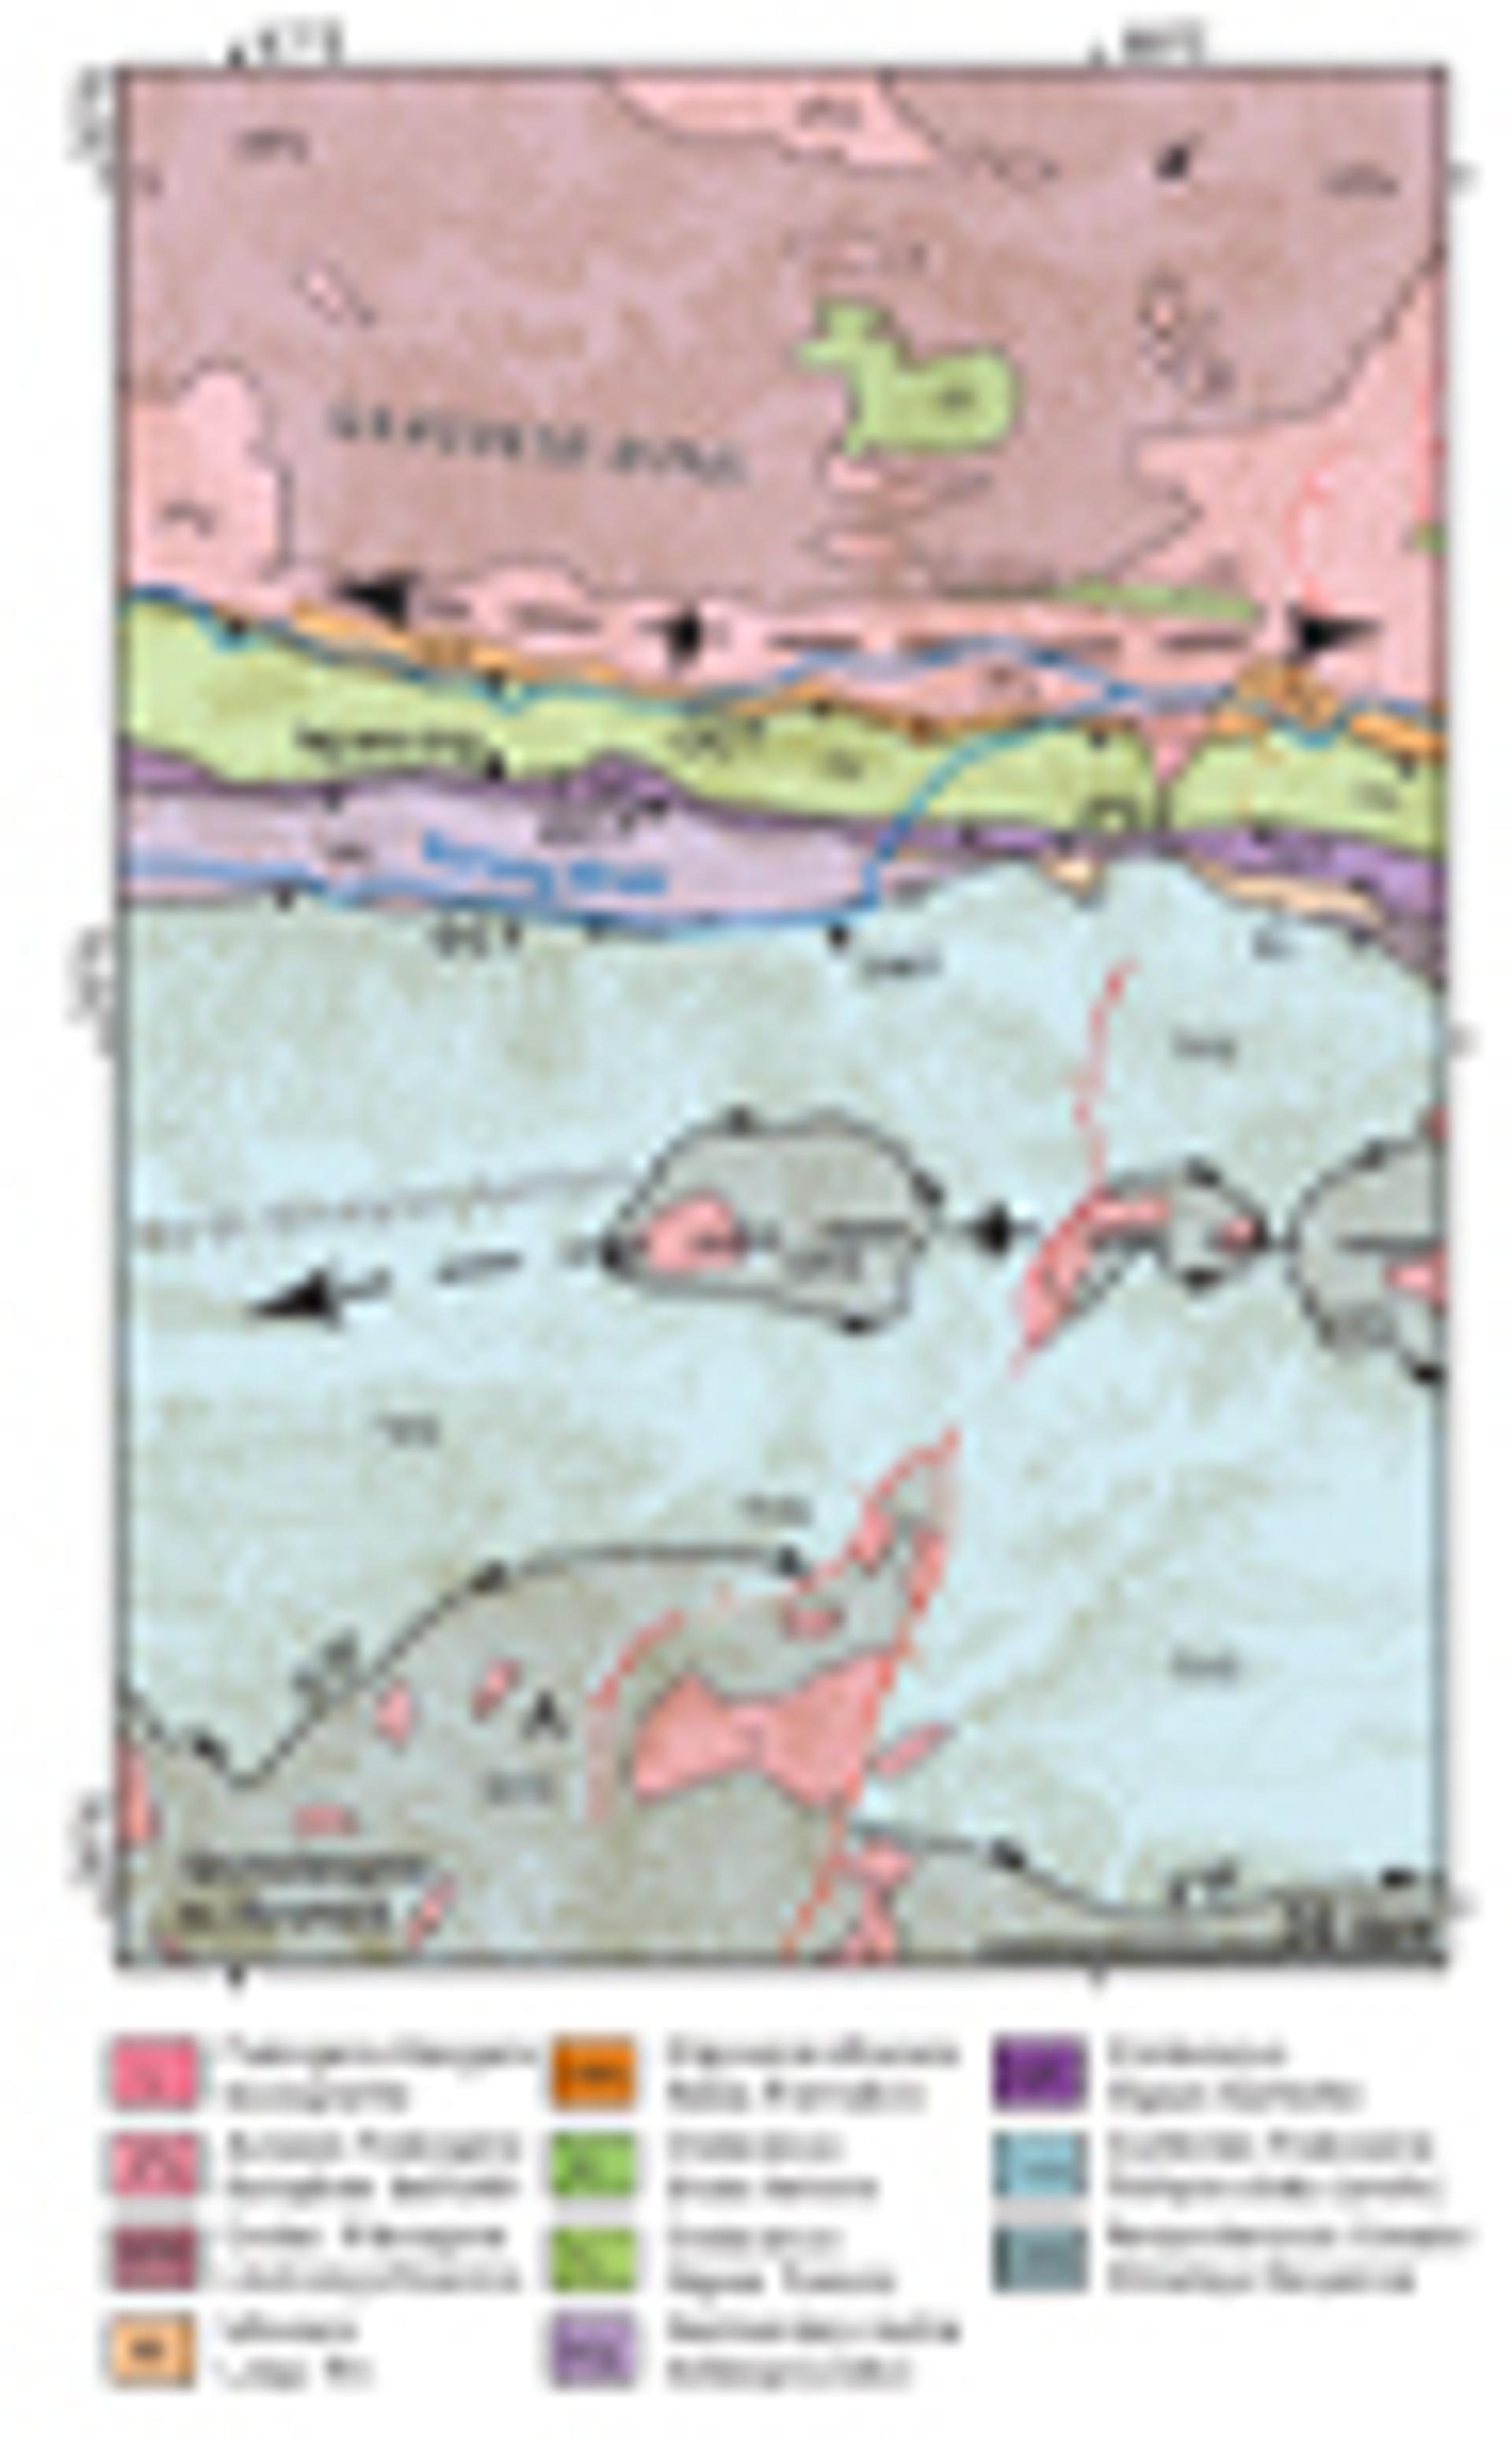
Geologic map with rock units (see Fig. 1). GCT—Great Counter Thrust system; IYSZ—Indus-Yarlung suture zone; STF—South Tibetan Fault. Bold dashed lines with arrows are antiforms—fold axis for the Gangdese Range with the long axis of asymmetric diamond indicates steeply south-dipping Kailas Formation. Red lines—active normal faults. Elevation contours are 200 m and 500 m (bold). Modified from Laskowski et al. (2018).
Figure 3
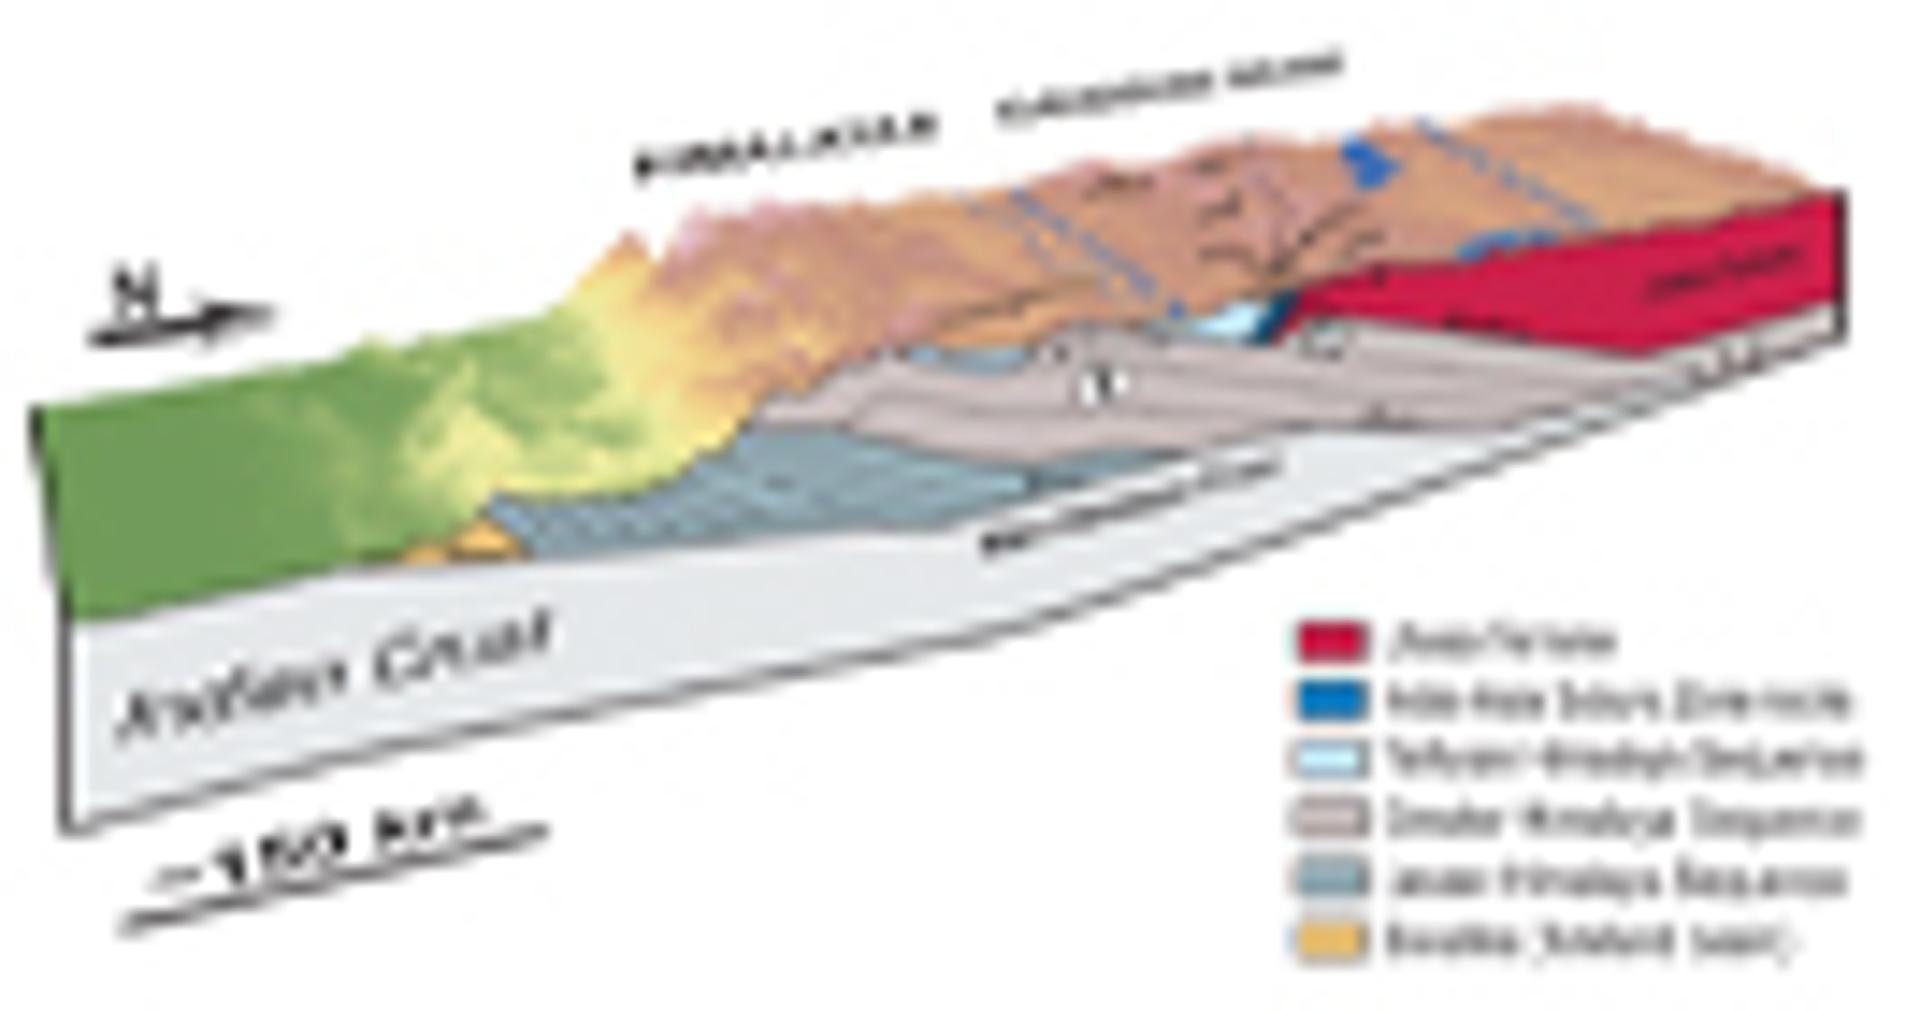
Model of the Indo-Asian collision illustrating rock uplift above thrust ramps (Main Himalayan Thrust) or duplexes forming topographic relief for the Gangdese Range, and a topographic divide between internal and external drainage (dashed black line) controlling flow direction of the Yarlung River (solid blue line). Himalayan gneiss domes (1) and the Gangdese Duplex (2). Structures adapted from Laskowski et al. (2018), Long et al. (2011), and Nábělek et al. (2009). (VE = 5.) GCT—Great Counter Thrust system; GT—Gangdese Thrust.
Figure 4
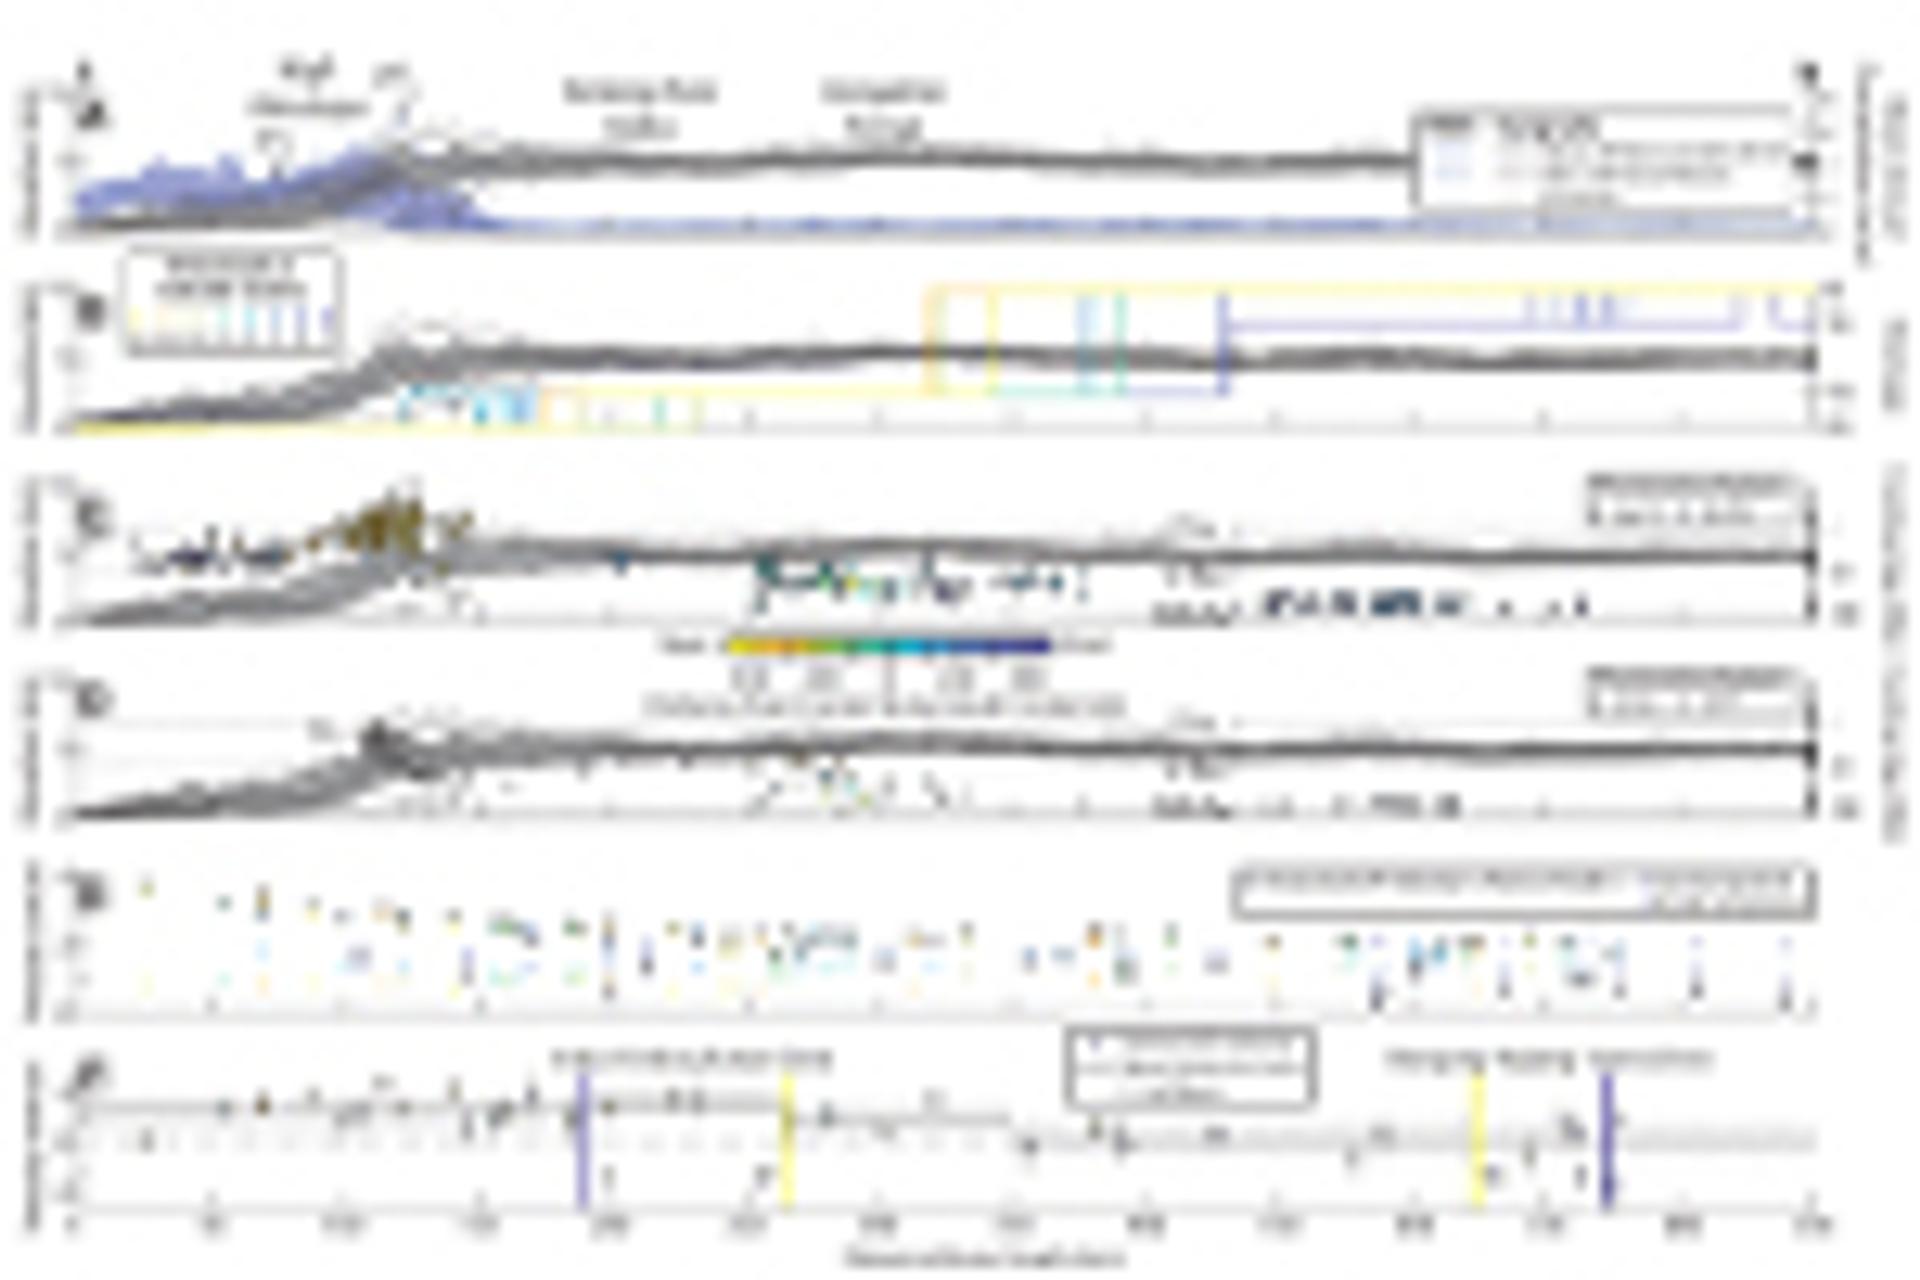
Swath profile of areas in Figure 1. (A) Averages of sixteen 20-km-wide swaths through Shuttle Radar Topography Mission 90 m elevation and Tropical Rainfall Measurement Mission 2B31 (Bookhagen and Burbank, 2006) mean annual precipitation. Topographic swath is the same for panels B, C, and D. PT—physiographic transition. (B) 20-km-wide swaths showing the location of major divides between the internally drained Tibet (ID), three rivers (TR), Yarlung (YA), and frontal Himalaya rivers (FR). Swath locations are shown in Figure 1 and colored by distance from swath center. (C) Apatite and (D) zircon thermochronology data from Thiede and Ehlers (2013) and Laskowski et al. (2018), colored by distance from the centerline, with y-axis position for cooling age. (E) Projected horizontal global positioning system (GPS) velocities in the plane of individual swaths (solid symbols) and the corresponding N and E components (Liang et al., 2013). (F) All available data for the vertical component of GPS velocities (Liang et al., 2013). Solid black lines—average of defined zones; dotted lines—one standard deviation of the mean.
The India-Asia Collision Zone and the Gangdese Range
The India-Asia collision zone presently absorbs ~4 cm/yr of geodetic convergence as India moves in the N20E direction relative to stable Eurasia (Zhang et al., 2004). Most agree that the Main Himalayan Thrust (MHT) and its updip imbricate fault splays accommodate the majority of convergence at depth at geodetic and millennial time scales (18–22 cm/yr) (Ader et al., 2012; Lavé and Avouac, 2000). However, disagreement exists on whether the downdip geometry of the MHT is planar, involves crustal ramps beneath the high-relief topographic steps (e.g., Whipple et al., 2016; Ghoshal et al., 2020), or if surface breaking splay faults accommodate a significant portion of India-Asia convergence (e.g., Murphy et al., 2013). Seismic imaging is consistent with a low-angle (10–20°) north-dipping décollement for the MHT, with its northward extent occurring below the main Himalayan peaks at ~50 km depth (Makovsky and Klemperer, 1999). North of the main Himalayan peaks are the northern Himalayan gneiss domes, which are exposed between the South Tibetan fault system in the south and the Indus-Yarlung suture (IYS) zone to the north (Figs. 2 and 3). The gneiss domes are cored by variably deformed orthogneiss and locally are intruded by leucogranites, emplaced between 37 and 34 Ma (e.g., Lee et al., 2000; Larson et al., 2010). The gneiss domes are juxtaposed against Tethyan sedimentary rocks in the hanging wall, with rapid cooling regionally initiating by 12 ± 4 Ma (Lee et al., 2004) (Figs. 2 and 3).
The remainder of active convergence is accommodated throughout the Tibetan plateau by north-striking normal faults and generally northeast- and northwest-striking strike-slip structures (e.g., Taylor and Yin, 2009). The geometry and kinematics of active structures accommodating east-west extension across southern Tibet and fault scarps are consistent with recent seismogenic activity (Taylor and Yin, 2009). Since the onset of extension may date when the Tibetan plateau attained its maximum elevation, this timing has been determined primarily by understanding the exhumation history of the footwalls of north-striking normal faults. One example is the northern Lunggar Rift that locally has up to 25 km of top-to-the-east displacement and initiated in the middle Miocene with uniformly low slip rates (<1 mm/yr) (Sundell et al., 2013). In the late Miocene, slip rates of rift bounding faults increased up to 5 mm/yr beginning in the southern Lunggar Rift, and accelerated northward, perhaps in response to the northward underthrusting of India (Sundell et al., 2013; Styron et al., 2015). Rift-bounding normal faults in the Yadong Gulu section of the Nyainqentanglha initiated at ca. 8 Ma based on results using 40Ar/39Ar thermochronology (Harrison et al., 1992). In southernmost Tibet near Xigaze, a north-trending dike was dated at 18 Ma and is thought to represent the time when east-directed extension initiated (Yin et al., 1994), but whether diking represents a regional extensional event is debated. The dynamic causes for the development of the active structures accommodating east-west–directed extension are discussed by Blisniuk et al. (2001), Kali et al. (2010), Langille et al. (2010), Yin and Taylor (2011), Sundell et al. (2013), and Styron et al. (2015).
Here we focus on the Gangdese Range of southern Tibet that locally has nine active NNW-striking normal faults we refer to as the Gangdese Rifts, located north of the IYS zone and west of Tangra Yum Co (Figs. 1 and 3). A potential mechanism for their formation is discussed in Yin (2000).
Geology of the Gangdese Range
Locally, elevations for the Gangdese Range exceed 7500 m, forming the southern boundary of the internally drained region of the Tibetan plateau (Figs. 1 and 5). The Gangdese Rifts are active structures and are shorter in length than the seven more well-studied longer rifts cutting the entire Lhasa terrane (e.g., Tangra Yum Co Rift)—along-strike lengths of the Gangdese Rifts are between 30 and 50 km. Detailed studies of the Gangdese Rifts are lacking, but a recent study concludes that the initiation age for one Gangdese Rift is ca. 16 Ma using zircon U-Th/He data (Burke et al., 2021). The Gangdese Rifts become more northwest striking in the western Lhasa terrane, and rift-bounding faults are more linear in map pattern with the westernmost rifts, suggesting an increase in oblique (i.e., dextral strike-slip) motion (see Fig. S1 in the Supplementary Material1). The Gangdese Rifts cut several regional structures, including the north-directed Great Counter Thrust (GCT) and the south-directed Gangdese Thrust (GT) (Yin et al., 1994) (Figs. 1 and 2). Crosscutting relationships—including the timing of Kailas Formation deposition between 26 and 23 Ma (Leary et al., 2016), the timing of slip across north-striking normal faults that cut the GCT (Sundell et al., 2013), and the age of a crosscutting pluton near the town of Lazi at ca. 10 Ma (Laskowski et al., 2018)—are consistent with the GCT being active between 23 and 16 Ma.
Figure 5
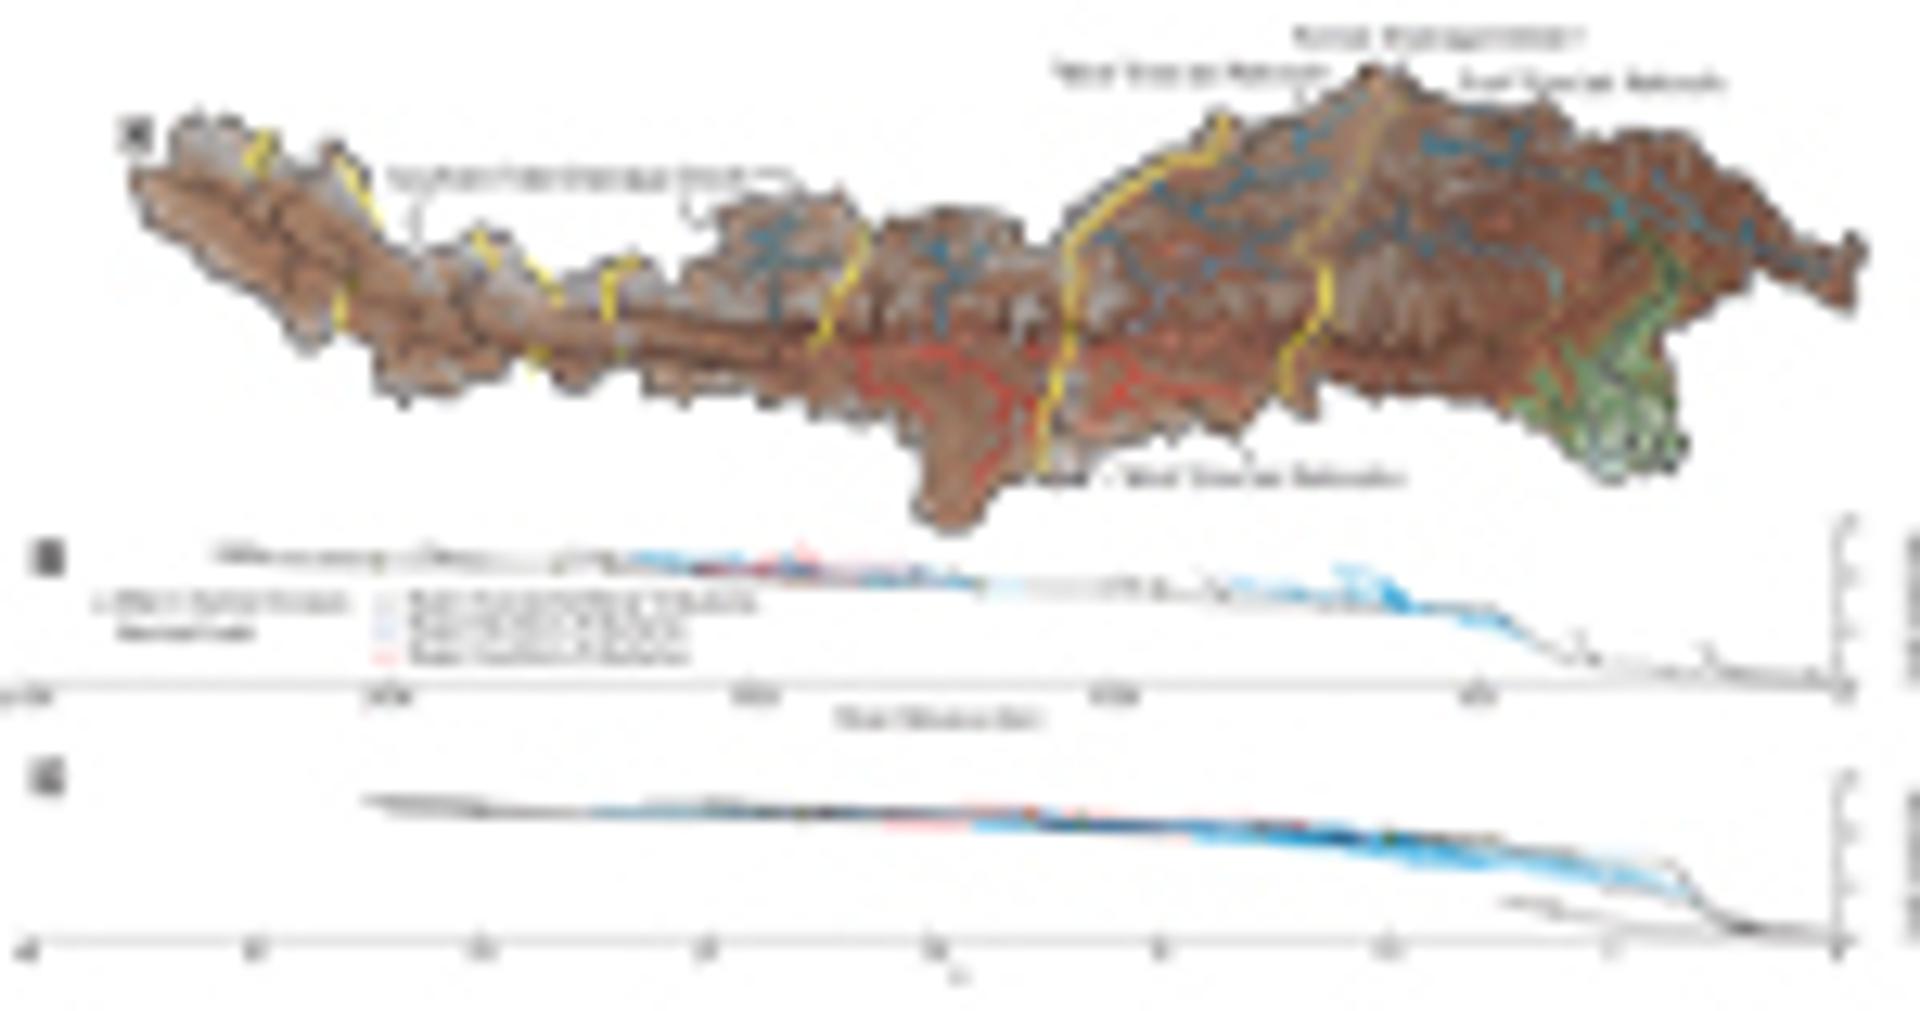
(A) Yarlung catchment with stream network. See Figure 1 for location. White dots indicate large junction angles consistent with west-directed paleoflow of the Yarlung River. Yellow stars mark reference locations on panels B and C. (B) Long profile with tributaries north (blue) and south (red) of the main river. (C) χ-elevation profile of B. Thick yellow lines—active normal faults.
-------
1Supplemental Material. Description of the methodology for projecting various data types onto the swath profiles in Fig. 4 along with Google Earth imagery for evidence of an increase in the strike-slip component of faulting along the Gangdese Rifts in western Tibet. Go to https://doi.org/10.1130/GSAT.S.14681367 to access the supplemental material; contact editing@geosociety.org with any questions.
The south-directed GT (e.g., Yin et al., 1994) carries plutonic rocks across a north-dipping shear zone. 40Ar/39Ar thermochronology data near Lhasa suggest the GT was active between 27 and 23 Ma (Harrison et al., 1992). However, other studies argue that the GT is not exposed along the IYS zone, and therefore is not a mechanism for accommodating large-magnitude crustal thickening (Aitchison et al., 2003). Alternatively, the GT may be a shear zone difficult to identify in the field because it is either largely buried under the Kailas Formation, the GT occurs in the footwall of the GCT, or the GCT forms a branch line with the GT, forming a roof and floor thrust respectively, to a north-dipping duplex beneath the Gangdese Range. The map pattern is consistent with the Gangdese duplex forming an asymmetric south-verging antiform (Figs. 2 and 3), with a steeply south-dipping forelimb of Kailas Formation in the south, and a gently north-dipping backlimb of Linzizong volcanic rocks to the north (Figs. 2 and 3). The crest of the antiform is located at the southern Tibet drainage divide and locally is cut by the north-striking Gangdese Rifts (Figs. 1 and 5).
To better understand the structural and geomorphological complexities associated with the Gangdese Range, we compiled topographic (Lehner et al., 2008), low-temperature thermochronometer (Thiede and Ehlers, 2013; Laskowski et al., 2018), geodetic (Liang et al., 2013), and rainfall (Bookhagen and Burbank, 2006) data for the Himalaya and Tibet onto a single, composite north-south swath profile (Fig. 4). A full description of the data projections for assembling Figure 4 is provided in the supplemental material (see footnote 1).
Is Gangdese Duplexing Active?
A recent structural model links the GCT with the Gangdese Thrust, interpreted as the largely buried roof thrust of a north-dipping duplex (Laskowski et al., 2018). The Gangdese duplex model is consistent with seismic reflection data gathered during the INDEPTH active-source and Hi-CLIMB experiments, with seismic imaging showing imbricated, north-dipping reflectors becoming shallower at upper structural levels (Makovsky and Klemperer, 1999; Nábělek et al., 2009). In the following, we suggest that the Gangdese duplex may be an active structure.
Elevations in Figure 4 illustrate the well-known high relief of the Himalaya rising from the Indian subcontinent. As noted previously (e.g., Bookhagen and Burbank, 2006), mean annual precipitation values are inversely correlated with elevation—this is clear in the low-elevation regions located south of the Himalaya receiving large amounts of precipitation (up to 4 m/year), compared to the arid interior of Tibet to the north.
Low-temperature thermochronologic data (Laskowski et al., 2018) show dominantly Miocene cooling ages over most of southern Tibet, with 23–15 Ma cooling, overlapping in time with development of the GCT (Fig. 4). North of the Gangdese Range and south of the Bangong-Nujiang suture zone, thermochronologic data show dominantly late Cretaceous cooling ages for central Tibet, consistent with little to no late Cenozoic exhumation. The thermochronometric data are also consistent with more recent exhumation across the ~150 km width of the Gangdese Range. Areas of focused exhumation across the Gangdese are co-located with GPS data showing significant positive vertical velocities, consistent with active exhumation.
A comprehensive data set of GPS velocities is presented in Liang et al. (2013), including sparse information about the vertical component of the velocity field (Fig. 4). The horizontal north-south component of the velocity field indicates north-south convergence ~40 mm/yr relative to stable Eurasia, with a velocity gradient of ~20 mm/yr across the Himalaya and the IYS zone, consistent with previous results (e.g., Bilham et al., 1997; Zhang et al., 2004). The vertical component of the interseismic velocity field also shows that the Himalayas are rising at 2.56 ± 1.23 mm/yr, consistent with both previous geodetic studies (e.g., Bilham et al., 1997; Liang et al., 2013) and surface uplift rates determined from geomorphology and leveling data (i.e., Lavé and Avouac, 2000). Surprisingly, the mean of the vertical component of the velocity field across an ~170-km-wide zone spanning the IYS zone and the Gangdese Range (Fig. 4) is 3.17 ± 0.46 mm/yr, which is similar within error to the vertical velocity measured for the Himalayas. The mean of the vertical velocity north of the Gangdese Range and south of the Bangong-Nuijiang suture zone gradually decreases from ~3 mm/year in the south, to 0.09 ± 1.57 mm/yr to the north. Locally, vertical velocities related to freeze-thaw cycles and other surface processes may occur in the proximity of the large saline lakes north of the Gangdese Range. However, because all of the available values of the vertical velocity field in the Liang et al. (2013) data set are positive across the Gangdese Range and show a significant velocity gradient, we view the data as consistent with active surface uplift across the entirety of the Gangdese (Fig. 4).
Hypothesized Mechanism for Internal Drainage Development
If surface uplift across the Gangdese Range is active, we posit the following hypothesis: fluvial reorganization of previously trans-Himalayan rivers with headwaters located in central Tibet, rerouted from a southward flow to northward into Tibet’s interior, by the creation of high topography across the Gangdese Range. The resulting high topography across the Gangdese Range led to development of the internally drained Tibetan plateau and drainage integration along the Indus-Yarlung suture zone, creating the modern headwaters for the Yarlung River. The GPS vertical velocity field is consistent with surface uplift of the Gangdese Range ongoing today, and that deep-seated crustal shortening (e.g., DeCelles et al., 2002; Styron et al., 2015) is balanced by upper crustal extension, rather than surface lowering due to pure shear deformation that occurs to the north in central Tibet (Taylor and Yin, 2009). Pure shear dilation, crustal thinning, and surface lowering is a key prediction arising from models of extensional collapse for the entire Tibetan plateau (e.g., Ge et al., 2015), but is inconsistent with results of active surface uplift across the Gangdese Range.
The vertical component of the GPS velocity field and geologic observations described in the previous sections suggests that active crustal thickening is occurring ~150 km north of the High Himalayan physiographic transition (e.g., PT2, Fig. 4A; Hodges et al., 2004). This is incompatible with all current models of Himalayan shortening, where the active thrust wedge does not extend into Tibet. Our findings effectively extend the orogenic thrust wedge well into Tibet, where the MHT soles into a north-dipping thrust ramp below the Gangdese Range (Fig. 2). Our model, combined with the geometry of the Gangdese Rift and Great Counter Thrust systems, explains the GPS, topographic, and exhumation patterns of the Tibetan plateau (Figs. 2 and 4).
In addition to causing a flow reversal of previously trans-Himalayan rivers, we suggest the same process likely elevated surface topography to a critical threshold in the western region of the southern Gangdese Range and IYS zone (Fig. 1), also resulting in the reversal of the paleo west-flowing Yarlung River to its modern eastward course. Locally, the geomorphology of the east-flowing Yarlung River and its tributaries is paradoxical, with much of its drainage network topology consistent with paleo-westward flow. One example is a large (~180°) junction angle between the Yarlung and Lhasa rivers (Burrard and Hayden, 1907) with at least three additional and exceptionally large junction angles farther west, up to river distance of ~1300 km (Fig. 5). A recent alternative hypothesis for this junction angle involves antecedence (Laskowski et al., 2019), but this interpretation is not mutually exclusive. Additionally, former significant (now breached) drainage divides preserved in the eastern half of the Yarlung network divide nominally east-directed tributaries from west-directed tributaries (Fig. 5A). The timing of an inferred westward flow for the Yarlung River is unknown. However, a recent study using detrital zircons suggests a connection between the Indus River and the Gangdese Range (Bhattacharya et al., 2021)—if correct, this is consistent with a west-flowing Yarlung River by ca. 27 Ma. Finer-scale evidence for past drainage network instability is observed for the Yarlung River and its tributaries, with several prominent knickpoints located downstream where the Yarlung River flows across the footwalls of several active north-striking normal faults related to the Tibetan rift systems—the most prominent occurs at river distance ~900 km, which resembles a now-breached former drainage divide (Fig. 5). The Yarlung River continues its flow path into the well-known Tsangpo gorge at the eastern Himalayan syntaxis (Fig. 5) (Zeitler et al., 2001; Lang and Huntington, 2014). Our hypothesized evolution for the topography of southern Tibet and the Himalayas is largely consistent with available provenance work from the Himalayan foreland (e.g., Lang and Huntington, 2014; Zhang et al., 2012), though in detail differs with many prior hypothesized scenarios for integration of the Yarlung River by the early Miocene. Ultimately, constraining the history of the Yarlung will require linking detailed new geologic and geomorphic observations along the Yarlung and its tributaries with these downstream records.
Geologic and geomorphic observations in tandem with interseismic geodetic velocities show that southern Tibet is undergoing surface uplift at a rate comparable to the Himalayas along the north side of the Yarlung River, and that this uplift has been sustained potentially, since at least middle Miocene time based on recent exhumation patterns revealed from thermochronology. Our synthesis is consistent with the growth of topography associated with the development of thrust duplexing, playing an integral role in shaping the internally drained Tibetan plateau. Our preliminary work on this active project has likely raised more questions than answers, and we plan to host special sessions at a future Geological Society of America meeting to better understand processes associated with fluvial reorganizations in active orogens.
Acknowledgments
We thank Delores Robinson for insightful reviews that improved the clarity of the manuscript. We also acknowledge helpful discussions with Andrew Hoxey, Paul Kapp, John Gosse, Michael Murphy, Clay Campbell, Kelin Whipple. and Peter Clift. This project is funded by the National Science Foundation to Forte (EAR-1917695), Laskowski (EAR-1917685), and Taylor (EAR-1917706).
References Cited
- Ader, T., Avouac, J., Zeng-Liu, J., Lyon-Caen, H., Bollinger, L., Galetzka, J., Genrich, J., Thomas, M., Chanard, K., Sapkota, S., Rajaure, S., Shrestha, P., Ding, L., and Fluozat, M., 2012, Convergence rate across the Nepal Himalaya and interseismic coupling on the Main Himalayan Thrust: Implications for seismic hazard: Journal of Geophysical Research, v. 117, B04403, https://doi.org/10.1029/2011JB009071.
- Aitchison, J.C., Davis, A.M., and Luo, H., 2003, The Gangdese Thrust: A phantom structure that did not raise Tibet: Terra Nova, v. 15, no. 3, p. 155–162, https://doi.org/10.1046/j.1365-3121.2003.00480.x.
- Bhattacharya, G., Robinson, D.M., and Wielicki, M.M., 2021, Detrital zircon provenance of the Indus Group, Ladakh, NW India: Implications for the timing of the India-Asia collision and other synorogenic processes: Geological Society of America Bulletin, v. 133, no. 5–6, p. 1007–1020, https://doi.org/10.1130/B35624.1.
- Bilham, R., Larson, K., Freymueller, J., Jouanne, F., LeFort, P., Leturmy, P., Mugnier, J.L., Gamond, J.F., Glot, J.P., Martinod, J., Chaudury, N.L., Chitrakar, G.R., Gautam, U.P., Koirala, B.P., Pandey, M.R., Ranabhat, R., Sapkota, S.N., Shrestha, P.L., Thakuri, M.C., Timilsina, U.R., Tiwari, D.R., Vidal, G., Vigny, C., Galy, A., and de Voogd, B., 1997, GPS measurements of present-day convergence across the Nepal Himalaya: Nature, v. 386, no. 6620, p. 61–64, https://doi.org/10.1038/386061a0.
- Blisniuk, P.M., Hacker, B.R., Glodny, J., Ratschbacher, L., Bi, S., Wu, Z., McWilliams, M.O., and Calvert, A., 2001, Normal faulting in central Tibet since at least 13.5 Myr ago: Nature, v. 412, p. 628–632, https://doi.org/10.1038/35088045.
- Bookhagen, B., and Burbank, D.W., 2006, Topography, relief, and TRMM-derived rainfall variations along the Himalaya: Geophysical Research Letters, v. 33, no. 8, L08405, https://doi.org/10.1029/2006GL026037.
- Burke, W.B., Laskowski, A.K., Orme, D.A., Sundell, K.E., Taylor, M.H., Guo, X., and Ding, L., 2021, Record of crustal thickening and syncon-vergent extension from the Dajiamang Tso Rift, Southern Tibet: Geosciences, v. 11, no. 5, p. 209, https://doi.org/10.3390/geosciences11050209.
- Burrard, S.G., and Hayden, H.H., 1907, A Sketch of the Geography and Geology of the Himalaya Mountains and Tibet: Superintendent Government Printing, India.
- DeCelles, P.G., Robinson, D.M., and Zandt, G., 2002, Implications of shortening in the Himalayan fold-thrust belt for uplift of the Tibetan Plateau: Tectonics, v. 21, no. 6, p. 12-1–12-25, https://doi.org/10.1029/2001TC001322.
- Fielding, E., Isacks, B., Barazangi, M., and Duncan, C., 1994, How flat is Tibet?: Geology, v. 22, p. 163–167, https://doi.org/10.1130/0091-7613(1994)022<0163:HFIT>2.3.CO;2.
- Ge, W.P., Molnar, P., Shen, Z.K., and Li, Q., 2015, Present-day crustal thinning in the southern and northern Tibetan plateau revealed by GPS measurements: Geophysical Research Letters, v. 42, no. 13, p. 5227–5235, https://doi.org/10.1002/2015GL064347.
- Ghoshal, S., McQuarrie, N., Robinson, D.M., Adhikari, D.P., Morgan, L.E., and Ehlers, T.A., 2020, Constraining central Himalayan (Nepal) fault geometry through integrated thermochronology and thermokinematic modeling: Tectonics, v. 39, no. 9, https://doi.org/10.1029/2020TC006399.
- Harrison, T.M., Copeland, P., Kidd, W.S.F., and Yin, A., 1992, Raising Tibet: Science, v. 255, p. 1663–1670, https://doi.org/10.1126/science.255.5052.1663.
- Hodges, K.V., Wobus, C., Ruhl, K., Schildgen, T., and Whipple, K., 2004, Quaternary deformation, river steepening, and heavy precipitation at the front of the Higher Himalayan ranges: Earth and Planetary Science Letters, v. 220, no. 3–4, p. 379–389, https://doi.org/10.1016/S0012-821X(04)00063-9.
- Horton, B.K., Yin, A., Spurlin, M.S., Zhou, J.Y., and Wang, J.H., 2002, Paleocene-Eocene syncontractional sedimentation in narrow, lacustrine-dominated basins of east-central Tibet: Geological Society of America Bulletin, v. 114, no. 7, p. 771–786, https://doi.org/10.1130/0016-7606(2002)114<0771:PESSIN>F2.0.CO;2.
- Kali, E., Leloup, P.H., Arnaud, N., Mahéo, G., Liu, D., Boutonnet, E., Van der Woerd, J., Liu, X., Liu-Zeng, J., and Li, H., 2010, Exhumation history of the deepest central Himalayan rocks, Ama Drime range: Key pressure-temperature-deformation-time constraints on orogenic models: Tectonics, v. 29, no. 2, TC2014, https://doi.org/10.1029/2009TC002551.
- Kapp, P., and DeCelles, P.G., 2019, Mesozoic–Cenozoic geological evolution of the Himalayan-Tibetan orogen and working tectonic hypotheses: American Journal of Science, v. 319, no. 3, p. 159–254, https://doi.org/10.2475/03.2019.01.
- Lang, K.A., and Huntington, K.W., 2014, Antecedence of the Yarlung–Siang–Brahmaputra River, eastern Himalaya: Earth and Planetary Science Letters, v. 397, p. 145–158, https://doi.org/10.1016/j.epsl.2014.04.026.
- Langille, J.M., Jessup, M.J., Cottle, J.M., Newell, D., and Seward, G., 2010, Kinematic evolution of the Ama Drime detachment: Insights into orogen-parallel extension and exhumation of the Ama Drime Massif, Tibet–Nepal: Journal of Structural Geology, v. 32, no. 7, p. 900–919, https://doi.org/10.1016/j.jsg.2010.04.005.
- Larson, K.P., Godin, L., Davis, W.J., and Davis, D.W., 2010, Out-of-sequence deformation and expansion of the Himalayan orogenic wedge: Insight from the Changgo culmination, south central Tibet: Tectonics, v. 29, no. 4, https://doi.org/10.1029/2008TC002393.
- Laskowski, A.K., Kapp, P., and Cai, F., 2018, Gangdese culmination model: Oligocene–Miocene duplexing along the India-Asia suture zone, Lazi region, southern Tibet: Geological Society of America Bulletin, v. 130, no. 7–8, p. 1355–1376, https://doi.org/10.1130/B31834.1.
- Laskowski, A., Orme, D., Cai, F., and Ding, L., 2019, The Ancestral Lhasa River: A Late Cretaceous trans-arc river that drained the proto–Tibetan Plateau: Geology, v. 47, no. 11, p. 1029–1033, https://doi.org/10.1130/G46823.1.
- Lavé, J., and Avouac, J.P., 2000, Active folding of fluvial terraces across the Siwaliks Hills, Himalayas of central Nepal: Journal of Geophysical Research, v. 105, no. B3, p. 5735–5770, https://doi.org/10.1029/1999JB900292.
- Leary, R.J., DeCelles, P.G., Quade, J., Gehrels, G.E., and Waanders, G., 2016, The Liuqu Conglomerate, southern Tibet: Early Miocene basin development related to deformation within the Great Counter Thrust system: Lithosphere, v. 8, no. 5, p. 427–450, https://doi.org/10.1130/L542.1.
- Lee, J., Hacker, B.R., Dinklage, W.S., Wang, Y., Gans, P., Calvert, A., Wan, J.L., Chen, W.J., Blythe, A.E., and McClelland, W., 2000, Evolution of the Kangmar Dome, southern Tibet: Structural, petrologic, and thermochronologic constraints: Tectonics, v. 19, no. 5, p. 872–895, https://doi.org/10.1029/1999TC001147.
- Lee, J., Hacker, B., and Wang, Y., 2004, Evolution of North Himalayan gneiss domes: Structural and metamorphic studies in Mabja Dome, southern Tibet: Journal of Structural Geology, v. 26, no. 12, p. 2297–2316, https://doi.org/10.1016/j.jsg.2004.02.013.
- Lehner, B., Verdin, K., and Jarvis, A., 2008, New global hydrography derived from spaceborne elevation data: Eos, Transactions American Geophysical Union, v. 89, no. 10, p. 93–94.
- Liang, S., Gan, W., Shen, C., Xiao, G., Liu, J., Chen, W., Ding, X., and Zhou, D., 2013, Three-dimensional velocity field of present-day crustal motion of the Tibetan Plateau derived from GPS measurements: Journal of Geophysical Research, Solid Earth, v. 118, no. 10, p. 5722–5732, https://doi.org/10.1002/2013JB010503.
- Long, S., McQuarrie, N., Tobgay, T., Grujic, D., and Hollister, L., 2011, Geologic map of Bhutan: Journal of Maps, v. 7, no. 1, p. 184–192, https://doi.org/10.4113/jom.2011.1159.
- Makovsky, Y., and Klemperer, S.L., 1999, Measuring the seismic properties of Tibetan bright spots: Evidence for free aqueous fluids in the Tibetan middle crust: Journal of Geophysical Research. Solid Earth, v. 104, no. B5, p. 10,795–10,825, https://doi.org/10.1029/1998JB900074.
- Murphy, M., Taylor, M., Gosse, J., Silver, C., Whipp, D., and Beaumont, C., 2014, Limit of strain partitioning in the Himalaya marked by large earthquakes in western Nepal: Nature Geoscience, v. 7, p. 38–42, https://doi.org/10.1038/ngeo2017,
- Nábělek, J., Hetényi, G., Vergne, J., Sapkota, S., Kafle, B., Jiang, M., Su, H., Chen, J., and Huang, B.-S., 2009, Underplating in the Himalaya-Tibet collision zone revealed by the Hi-CLIMB experiment: Science, v. 325, no. 5946, p. 1371–1374, https://doi.org/10.1126/science.1167719.
- Sobel, E.R., Hilley, G.E., and Strecker, M.R., 2003, Formation of internally drained contractional basins by aridity-limited bedrock incision: Journal of Geophysical Research. Solid Earth, v. 108, no. B7, https://doi.org/10.1029/2002JB001883.
- Styron, R., Taylor, M., and Sundell, K., 2015, Accelerated extension of Tibet linked to the northward underthrusting of Indian crust: Nature Geoscience, v. 8, no. 2, p. 131, https://doi.org/10.1038/ngeo2336.
- Sundell, K.E., Taylor, M.H., Styron, R.H., Stockli, D.F., Kapp, P., Hager, C., Liu, D., and Ding, L., 2013, Evidence for constriction and Pliocene acceleration of east-west extension in the North Lunggar rift region of west central Tibet: Tectonics, v. 32, no. 5, p. 1454–1479, https://doi.org/10.1002/tect.20086.
- Taylor, M., and Yin, A., 2009, Active structures of the Himalayan-Tibetan orogen and their relationships to earthquake distribution, contemporary strain field, and Cenozoic volcanism: Geosphere, v. 5, no. 3, p. 199–214, https://doi.org/10.1130/GES00217.1.
- Thiede, R.C., and Ehlers, T.A., 2013, Large spatial and temporal variations in Himalayan denudation: Earth and Planetary Science Letters, v. 371–372, p. 278–293, https://doi.org/10.1016/j.epsl.2013.03.004.
- Whipple, K.X., Shirzaei, M., Hodges, K.V., and Arrowsmith, J.R., 2016, Active shortening within the Himalayan orogenic wedge implied by the 2015 Gorkha earthquake: Nature Geoscience, v. 9, no. 9, p. 711–716, https://doi.org/10.1038/ngeo2797.
- Yin, A., 2000, Mode of Cenozoic east-west extension in Tibet suggesting a common origin of rifts in Asia during the Indo-Asian collision: Journal of Geophysical Research, Solid Earth, v. 105, no. B9, p. 21,745–21,759, https://doi.org/10.1029/2000JB900168.
- Yin, A., and Taylor, M.H., 2011, Mechanics of V-shaped conjugate strike-slip faults and the corresponding continuum mode of continental deformation: Geological Society of America Bulletin, v. 123, no. 9–10, p. 1798–1821, https://doi.org/10.1130/B30159.1.
- Yin, A., Harrison, T.M., Ryerson, F.J., Chen, W.J., Kidd, W.S.F., and Copeland, P., 1994, Tertiary structural evolution of the Gangdese Thrust system in southeastern Tibet: Journal of Geophysical Research, v. 99, p. 18,175–18,201, https://doi.org/10.1029/94JB00504.
- Zeitler, P.K., Meltzer, A.S., Koons, P.O., Craw, D., Hallet, B., Chamberlain, C.P., Kidd, W.S., Park, S.K., Seeber, L., and Bishop, M., 2001, Erosion, Himalayan geodynamics, and the geomorphology of metamorphism: GSA Today, v. 11, no. 1, p. 4–9, https://doi.org/10.1130/1052-5173(2001)011<0004:EHGATG>2.0.CO;2.
- Zhang, J., Yin, A., Liu, W., Wu, F., Lin, D., and Grove, M., 2012, Coupled U-Pb dating and Hf isotopic analysis of detrital zircon of modern river sand from the Yalu River (Yarlung Tsangpo) drainage system in southern Tibet: Constraints on the transport processes and evolution of Himalayan rivers: Geological Society of America Bulletin, v. 124, no. 9–10, p. 1449–1473, https://doi.org/10.1130/B30592.1.
- Zhang, P.Z., Shen, Z., Wang, M., Gan, W.J., Burgmann, R., and Molnar, P., 2004, Continuous deformation of the Tibetan Plateau from global positioning system data: Geology, v. 32, no. 9, p. 809–812, https://doi.org/10.1130/G20554.1.
