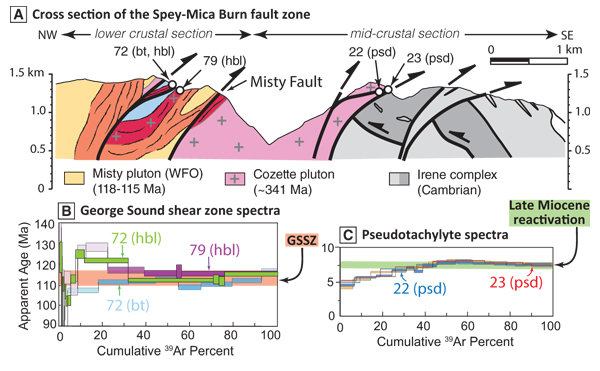
Figure 2.
(A) Cross section of the Spey-Mica Burn fault zone (location in Fig. 1A). Profile shows steep reverse faults (dark black lines) that uplifted and imbricated the George Sound shear zone (orange-red-lined patterns), placing Cretaceous lower crust to the SE over Cretaceous middle crust. Yellow and blue represent undeformed portions of the Misty pluton and older Jurassic–Early Cretaceous igneous rock, respectively. Orange-lined pattern represents sheared Misty pluton; dark red-lined pattern with plusses represents sheared Cozette pluton (samples 72 and 79). (B) Apparent 40Ar/39Ar age spectra from hornblende (hbl) and biotite (bt) from sample 72 and hornblende from sample 79 indicate George Sound shear zone (GSSZ) deformation occurred at 117–110 Ma (dots are dated samples). (C) Apparent 40Ar/39Ar age spectra from 8 to 7 Ma pseudotachylyte (psd) within splays of the Spey-Mica Burn fault zone (two runs each of samples 22 and 23). Similar ages were obtained from pseudotachylyte in the Mt. Thunder fault (Figs. DR2 and DR3 in the GSA Data Repository [see text footnote 1] show detailed spectra and a detailed map of the Spey-Mica Burn fault zone, respectively).