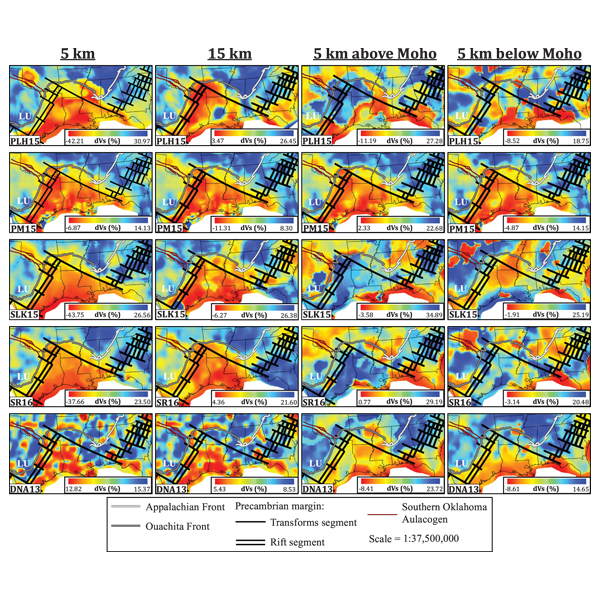
Figure 3.
Depth slices of shear wave velocity perturbations of models PLH15, PM15, SLK15, SR16, and DNA13 (rows; top to bottom) at 5-km, 15-km, 5-km above the Moho, and 5-km below the Moho (columns; left to right), with LU (white) highlighting the location of the Llano Uplift.