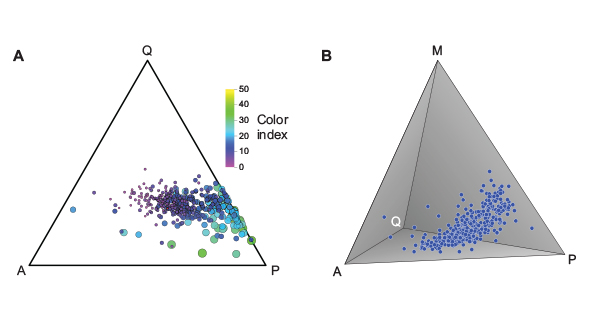
Figure 4.
Modal data for 403 quartz-bearing plutonic rocks from the Sierra Nevada batholith, plotted on the quartz-alkali feldspar-plagioclase (QAP) triangle and in a tetrahedron whose base is QAP and whose apex M represents mafic minerals. It is clear that the proportion of mafic minerals (color index) increases dramatically away from the center of the QAP triangle, toward the QP sideline. This trend is neglected by the International Union of Geological Sciences classification. Data from Bateman et al. (1984) and Bateman et al. (1988).