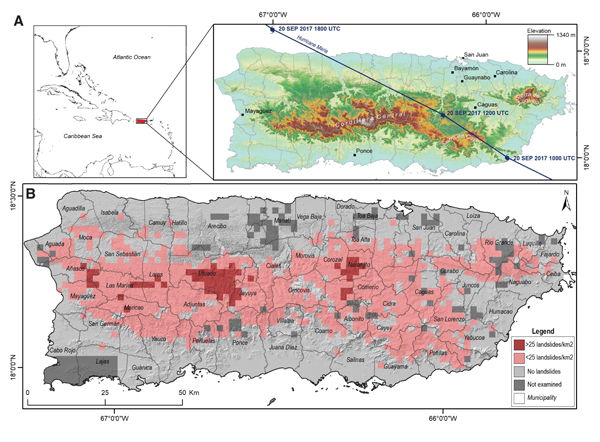
Figure 1.
(A) Topographic map of Puerto Rico showing the storm track of Hurricane Maria. (B) Relative density of landslides mapped from the rapid classification of satellite and aerial imagery and site visits following Hurricane Maria (updated from Bessette-Kirton et al., 2017).