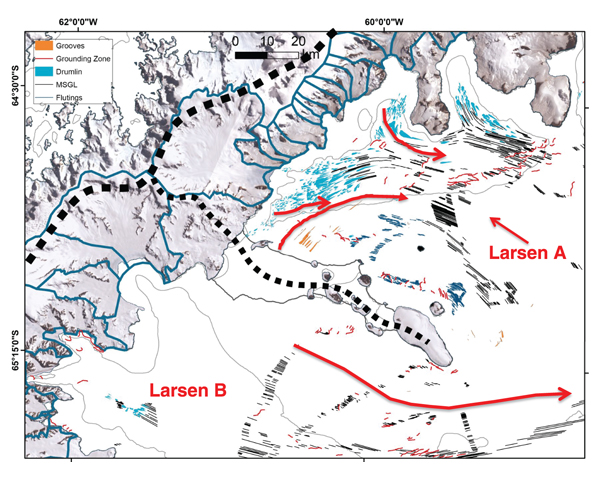
Figure 2.
Geomorphic features mapped on the seafloor of the Larsen A and Larsen B embayments, which were used for reconstructing paleo-ice flow patterns on the shelf. Features are mapped across the area where multibeam data were collected. Gaps in the feature mapping largely represent areas where no geophysical data could be collected due to extensive ice cover. Thin solid lines are 500 m bathymetry contour. Blue lines represent modern ice divides. Dashed lines represent paleo-ice divides (Lavoie et al., 2015). Based on mapping from Campo et al. (2017). MSGL—mega-scale glacial lineations.