Figure 1.
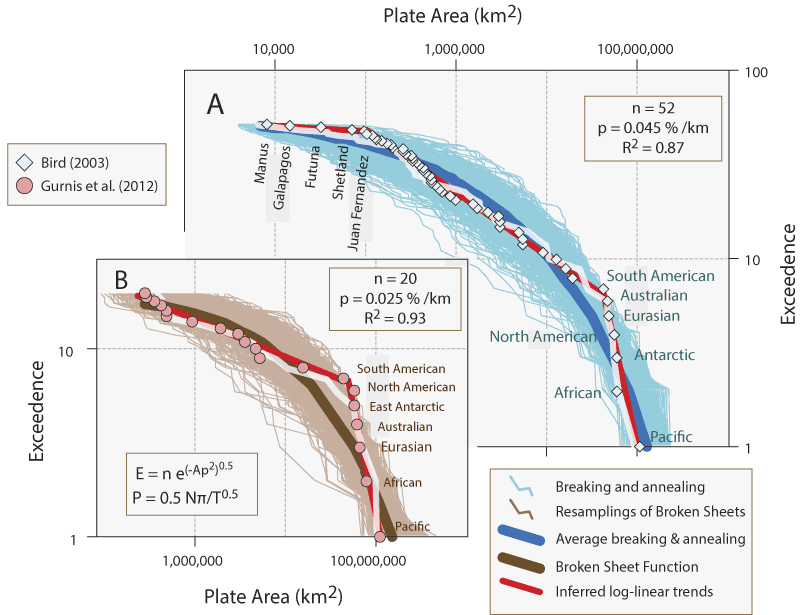
Areas of tectonic plates relative to exceedance, the number of plate areas equal to or greater than the x-axis values. (A) Plate areas from Bird (2003). (B) Areas from Gurnis et al. (2012). Division into three apparent subpopulations in (A) (n = 52) and two subpopulations in (B) (n = 20) is based on seemingly linear trends (straight red lines). Light blue lines in (A) are 500 sets of plate areas (n = 52) resampled from a stable model time series wherein two random plates are annealed and another two randomly divided over thousands of iterations (see text). Heavy blue line in (A) is the average area of many realizations of such annealed and broken plates. Light brown lines in (B) are 500 sets of plate areas (n = 20) resampled from the broken sheet density function. Heavy brown line in (B) is the ideal broken sheet size frequency distributions predicated by the number of designated plates (20) and the total area of the sphere on which they exist (4 π steradians; ~510 × 106 km2). White lines in (A) and (B) are the two series whose areas, by chance, are closest to observed sizes. Since there is no inherent division of sizes in these models, any subdivision based on the perception of differing slopes for straight-line segments is spurious.